

 Popular Countries
 24/7 Support

Updated
South Dakota, in the north-central United States, is best known for Mount Rushmore National Memorial, the wide-open grasslands of the Great Plains and its deep Native American heritage.
How many tourists visit South Dakota each year?
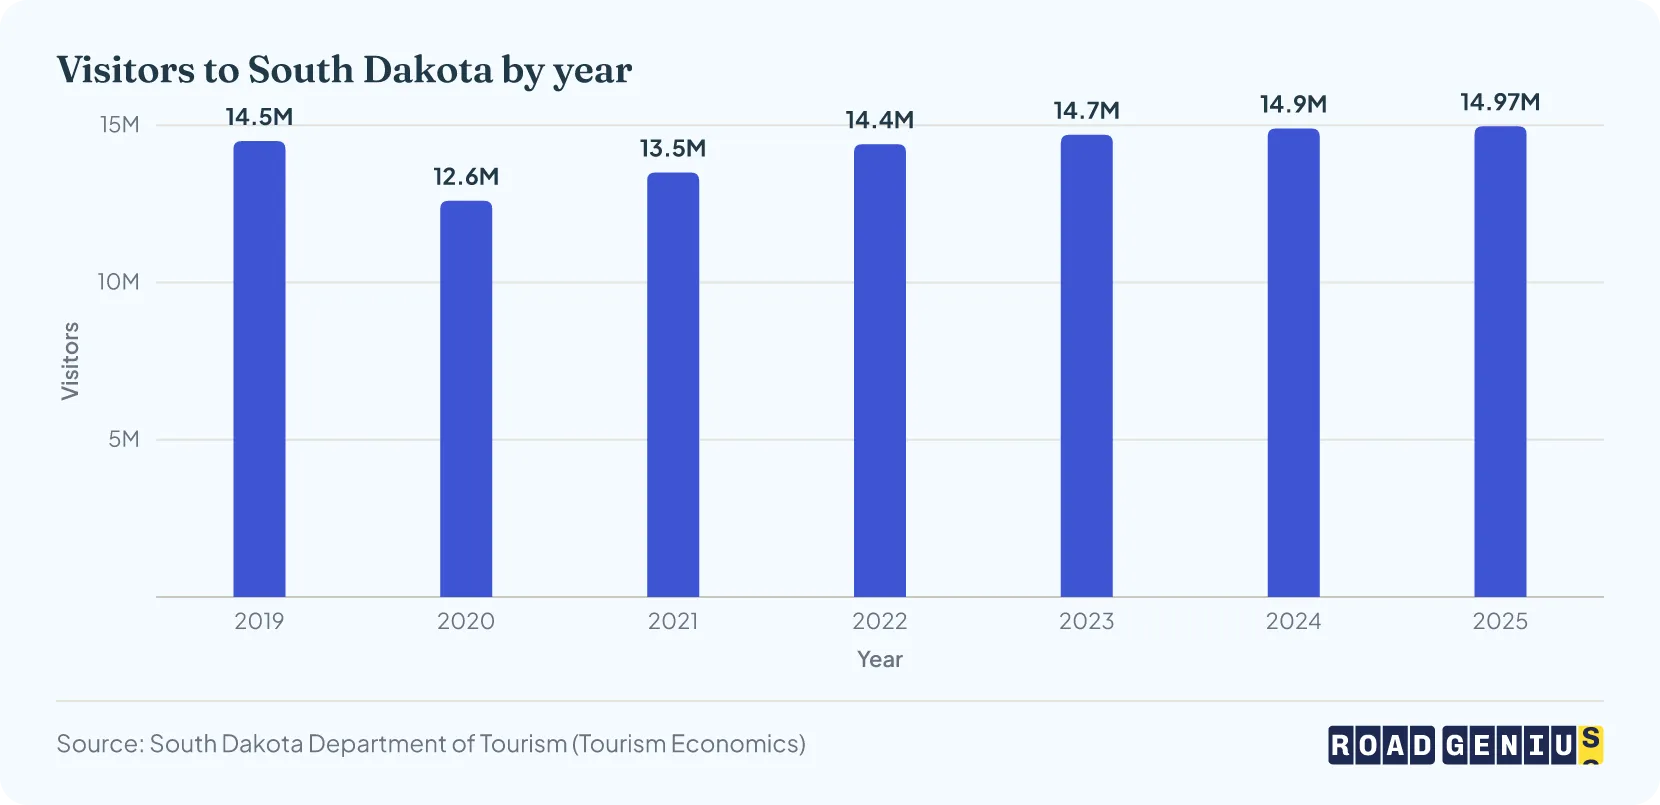
South Dakota welcomed a record 14.97 million visitors in 2025.1
- South Dakota drew 14.5 million visitors in 20192. The pandemic cut that by 13% to 12.6 million in 2020.
- Numbers recovered to 13.5 million in 20212 and 14.4 million in 2022.
- The total climbed to 14.7 million in 20232, 1.4% above the pre-pandemic level of 2019.
- South Dakota saw 14.9 million total visitors in 2024, up 1.4% from 20233 and 2.7% above 2019.
- Visitor numbers edged up 0.38% to 14.97 million in 20251, 3.2% above the 2019 level.
How much do tourists spend in South Dakota every year?
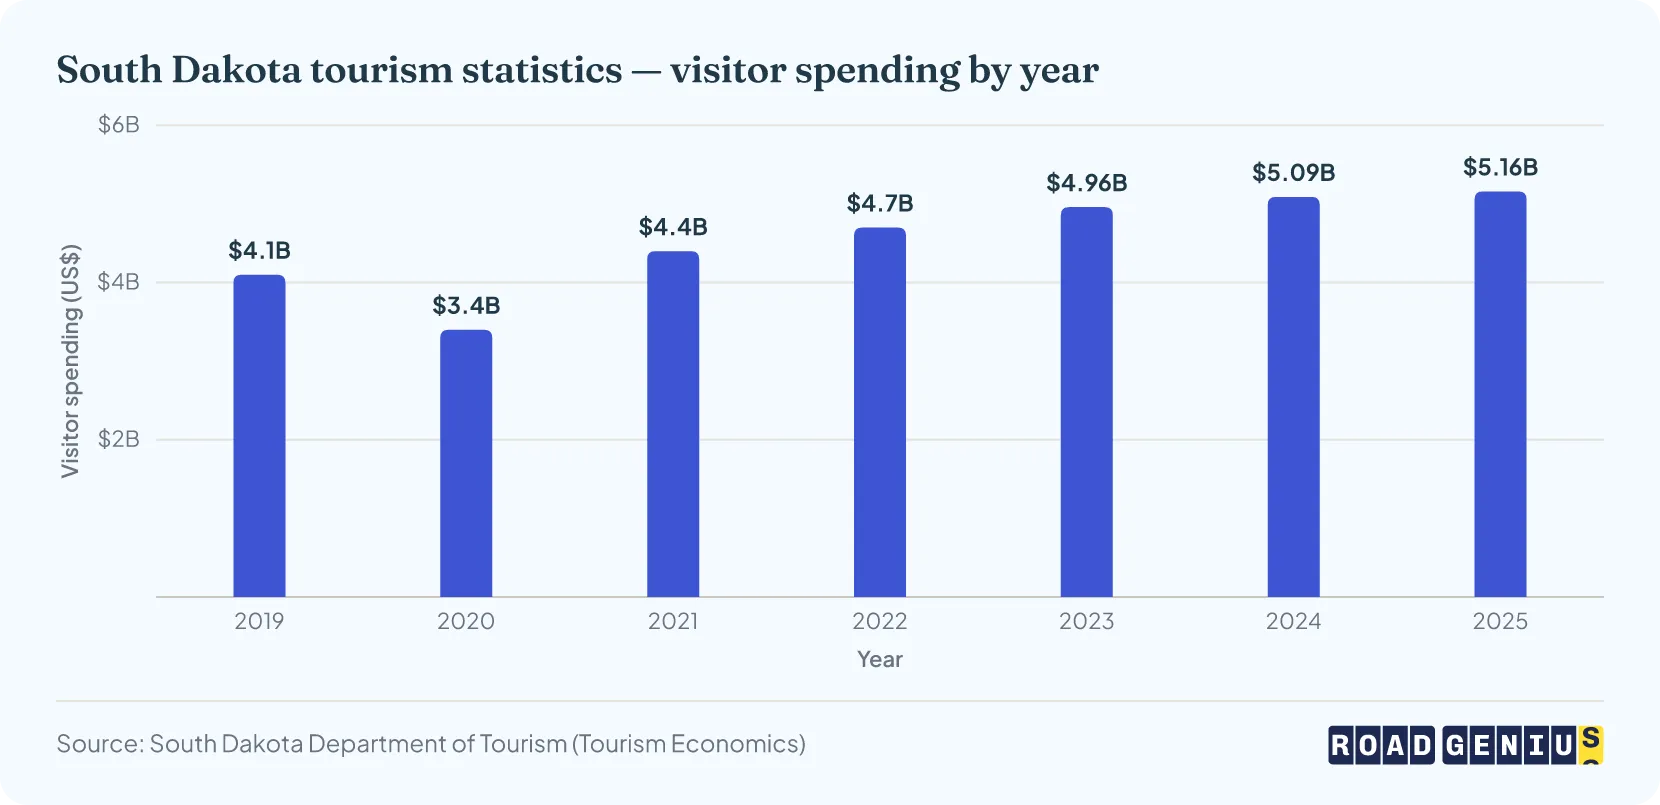
Visitors spent a record $5.16 billion in South Dakota in 2025.1
- In 2019, visitors spent $4.1 billion in South Dakota.2 The pandemic pushed spending down to $3.4 billion in 2020, but it bounced back to $4.4 billion in 2021.
- Spending climbed to $4.7 billion in 2022 and $4.96 billion in 20232, 21% above the pre-pandemic level.
- Tourist spending reached $5.1 billion in 2024, a 2.8% increase from 20232 and 24% more than in 2019.
- In 2025, spending rose 1.1% to $5.16 billion1, 26% above 2019.
How do visitors spend their money in South Dakota?
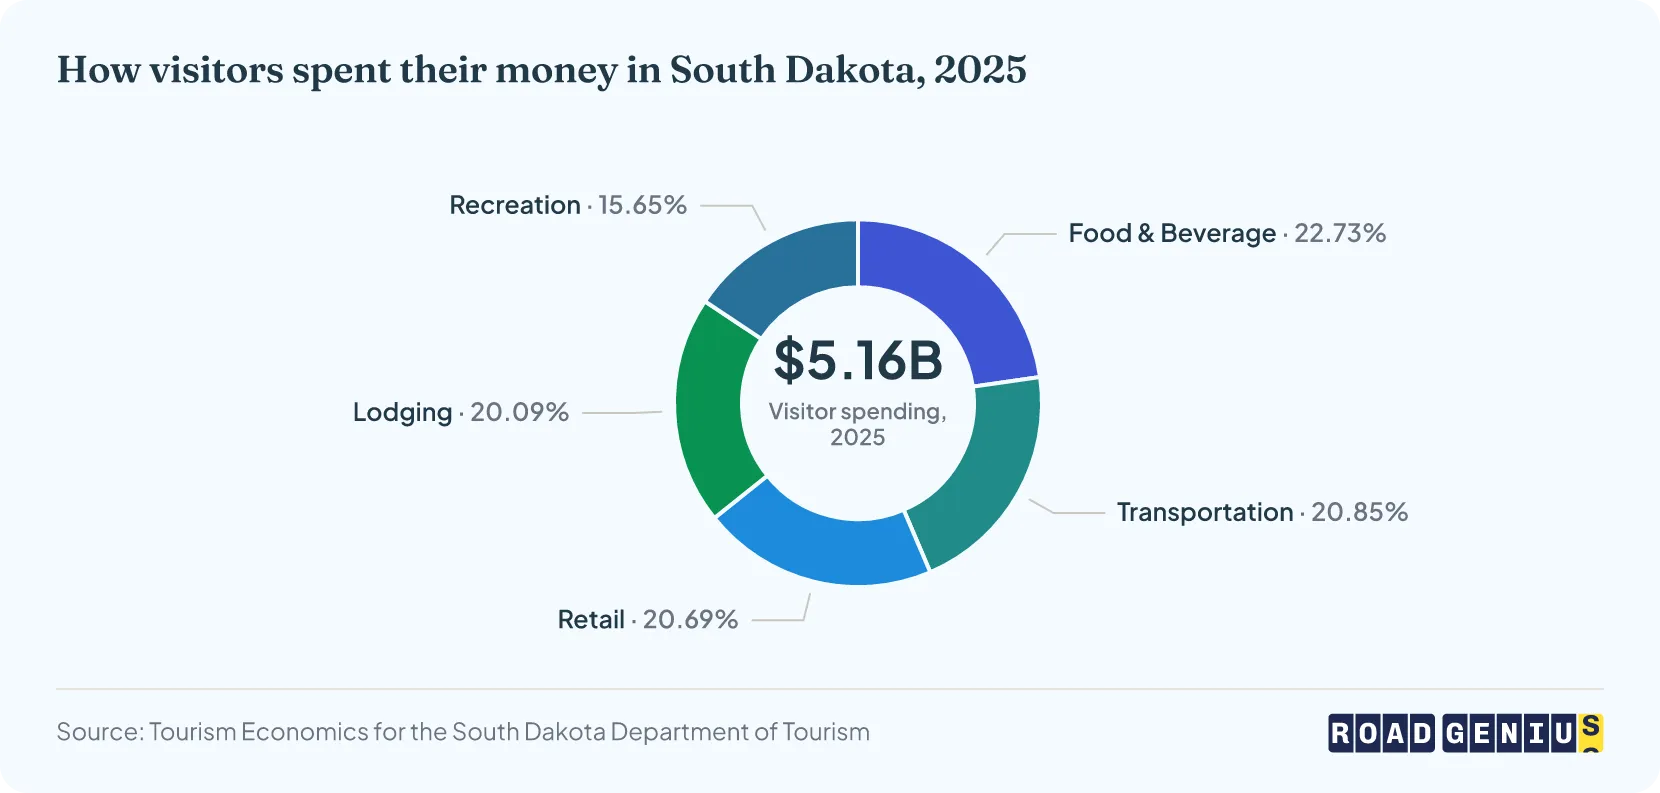
Visitors in South Dakota spent the most on food and beverage in 2025: $1.17 billion, or about 23% of all visitor spending.4
Where do visitors spend their money in South Dakota?
Visitor spending grew in three of South Dakota's four tourism regions in 2025.
- Spending rose 3.1% in Glacial Lakes and Prairies, 1.0% in the Black Hills and Badlands and 0.8% in the Southeast, and held steady in the Missouri River region.5
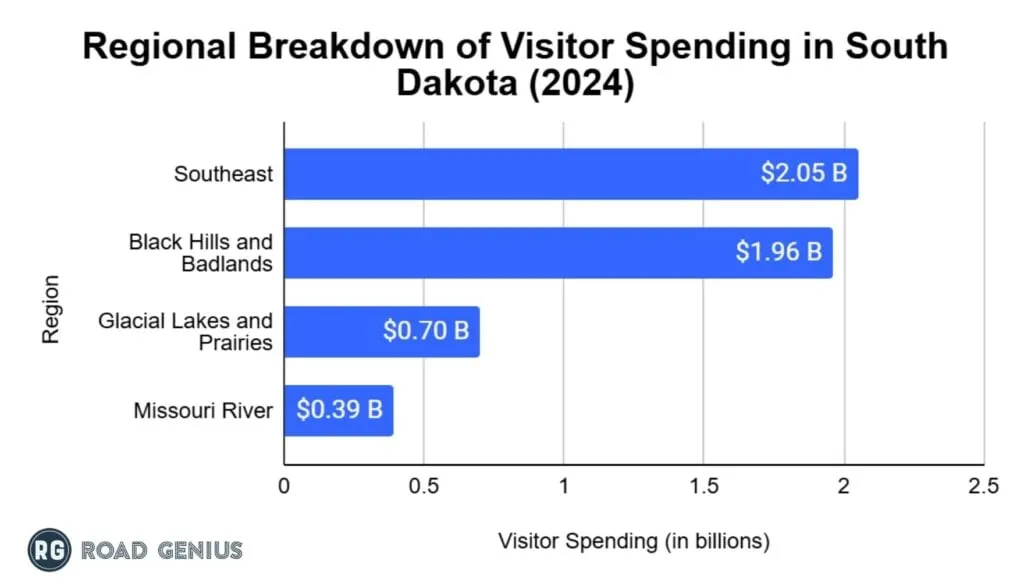
- The Southeast takes the largest share: visitors spent $2.05 billion there in 2024.6
- The Black Hills and Badlands region came a close second at $1.96 billion.6
- Visitors spent $700.5 million in Glacial Lakes and Prairies and $386.9 million in the Missouri River region.6
How much does it cost to visit South Dakota?
Visitors spent an average of $205.54 per trip in South Dakota in 2025, and leisure overnight visitors averaged $255.60 per trip.7
- Measured another way, total visitor spending of $5.16 billion across 14.97 million visitors works out to about $345 per visitor in 2025.1
- This spending covers lodging, dining, shopping, transportation and recreation.
Where do South Dakota's visitors come from?
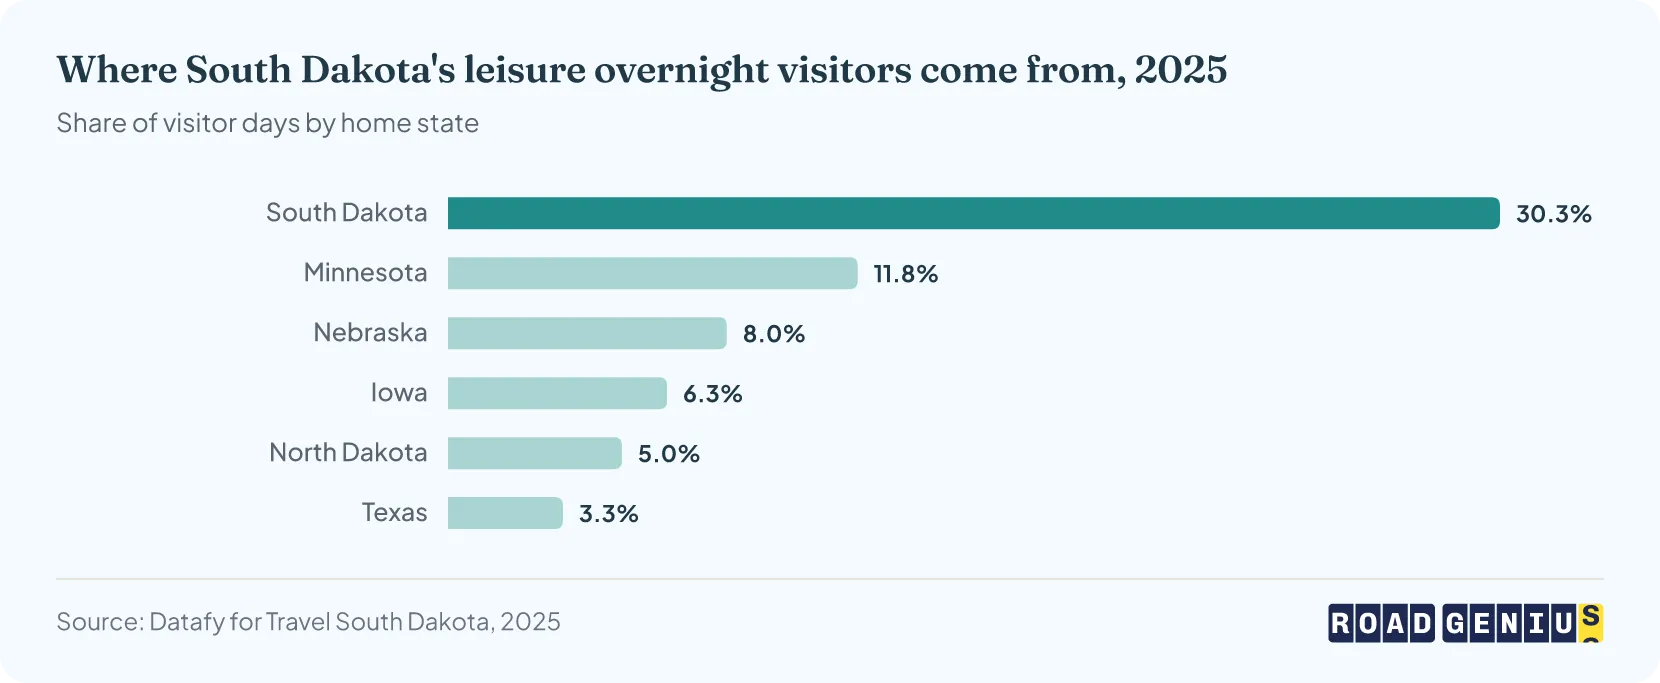
South Dakota residents made up the largest share of the state's visitors in 2025, followed by Minnesotans.
- Among domestic visitors who traveled 75 miles or more, about 31% came from within South Dakota and 12% from Minnesota, followed by Nebraska (8.3%), Iowa (6.9%) and North Dakota (5.2%). Texas was the largest source outside the neighboring states, at 2.9%.7
- Among leisure overnight visitors, South Dakotans accounted for 30.3% of visitor days and Minnesotans for 11.8%, followed by Nebraska (8.03%), Iowa (6.31%), North Dakota (5.01%) and Texas (3.31%).7
How long do visitors spend in South Dakota?
When is the best time to visit South Dakota?
The best time to visit South Dakota is from late May to September.
- Summer (June to August)
- This is peak season, with average temperatures between 66 and 73°F.
- Days are long, with up to 15–16 hours of sunlight, and August brings big crowds for the Sturgis Motorcycle Rally.
- Fall (September to November)
- Early fall, especially September, is another good time to go: the weather stays mild (around 63°F) and the leaves are turning.
How many people visit South Dakota's national parks and attractions?
Mount Rushmore National Memorial is South Dakota's most visited National Park Service site, with 1.91 million visits in 2025.8
- Badlands National Park drew 1.14 million visits in 2025, up 4.1% from 2024.9
- Wind Cave National Park recorded 606,258 visits in 2025, up 23.9%10, while Jewel Cave National Monument had 110,553.11
- In 2024, 8.7 million visitors went to South Dakota's state parks, such as Custer State Park, and 3.8 million explored its national parks.3
- The Black Hills and Badlands, home to Mount Rushmore and Custer State Park, topped the regions visited by leisure overnight visitors in 2025 (39.3%, ahead of the Southeast at 31.2%)7, although the Southeast takes the larger share of total visitor spending.
Why do people visit South Dakota?
- Many visitors come to see Mount Rushmore National Memorial, the mountain carving that celebrates American leadership, and the Crazy Horse Memorial, a work-in-progress tribute to the Lakota leader and Native American heritage. Learn more about Mount Rushmore National Memorial Tourism Statistics.
- Others come for the outdoors: Badlands National Park, known for its striking rock formations and wildlife, and Custer State Park, with its free-roaming bison and open scenery.
- Underground, Jewel Cave National Monument is one of the world’s longest caves12, with guided tours through its intricate formations.
What is the number one tourist attraction in South Dakota?
- The number one tourist attraction in South Dakota is Mount Rushmore National Memorial. The memorial features the carved faces of four U.S. presidents: George Washington, Thomas Jefferson, Abraham Lincoln, and Theodore Roosevelt.13
How much does tourism contribute to South Dakota's economy?
Tourism accounted for 4.7% of South Dakota's economy in 2025.1
- Jobs: Tourism supported 59,145 jobs and generated $2.3 billion in household income for South Dakotans.1
- Tax revenue: Visitor activity generated $406.1 million in state and local tax revenue, about $7 million more than in 2024, and 16.5% of all state sales tax collections.1
- Without tourism, each South Dakota household would pay an extra $1,121 in taxes.1
Car and Campervan Rental for a South Dakota Trip
More Statistics
- Colorado Tourism Statistics
- Destin Tourism Statistics
- Grand Canyon Tourism Statistics
- Florida Keys and Key West Tourism Statistics
- Miami Tourism Statistics
- Nevada Tourism Statistics
- Oahu Tourism Statistics
- Oregon Tourism Statistics
- Universal Studios Hollywood Tourism Statistics
- US Open Tourism Statistics
- Washington Tourism Statistics
- Washington DC Tourism Statistics
References
- 2025 Shows Continued Strength for South Dakota's Tourism Industry (South Dakota Department of Tourism release, January 21, 2026) · news.sd.gov ↑ b c d e f g h i
- Fast Facts About the South Dakota Tourism Industry (South Dakota Department of Tourism; Tourism Economics annual figures) · sdvisit.com ↑ b c d e f
- 2024 Shows Growth for South Dakota's Tourism Industry (South Dakota Department of Tourism press release, January 22, 2025) · sdvisit.com ↑ b
- Economic Impact of Tourism in South Dakota, 2025 (Tourism Economics for the South Dakota Department of Tourism, January 2026) · sdvisit.com ↑ b c
- Tourism Continues to Drive Economic Growth Across South Dakota (South Dakota Department of Tourism release, May 4, 2026) · news.sd.gov ↑
- Economic Impact of Tourism in South Dakota, 2024 — County Analysis (Tourism Economics for the South Dakota Department of Tourism, March 2025) · sdvisit.com ↑ b c
- What 2025 Told Us So Far About Visitors to South Dakota (Travel South Dakota / Datafy visitation webinar, December 2025) · sdvisit.com ↑ b c d e f
- NPS Visitor Use Statistics — Annual Park Recreation Visitation (1904 - Last Calendar Year), Mount Rushmore NMEM · irma.nps.gov ↑
- NPS Visitor Use Statistics — Annual Park Recreation Visitation (1904 - Last Calendar Year), Badlands NP · irma.nps.gov ↑
- NPS Visitor Use Statistics — Annual Park Recreation Visitation (1904 - Last Calendar Year), Wind Cave NP · irma.nps.gov ↑
- NPS Visitor Use Statistics — Annual Park Recreation Visitation (1904 - Last Calendar Year), Jewel Cave NM · irma.nps.gov ↑
- Jewel Cave National Monument (U.S. National Park Service) · nps.gov ↑
- Mount Rushmore National Memorial (U.S. National Park Service) · nps.gov ↑
