Popular Countries
 24/7 Support
Published
Car accident statistics in the United Kingdom (UK) show long-term improvements in reported road safety, alongside persistent challenges related to driver behaviour, casualty demographics, road type, and vehicle involvement.
How many car accidents occur in the UK annually?
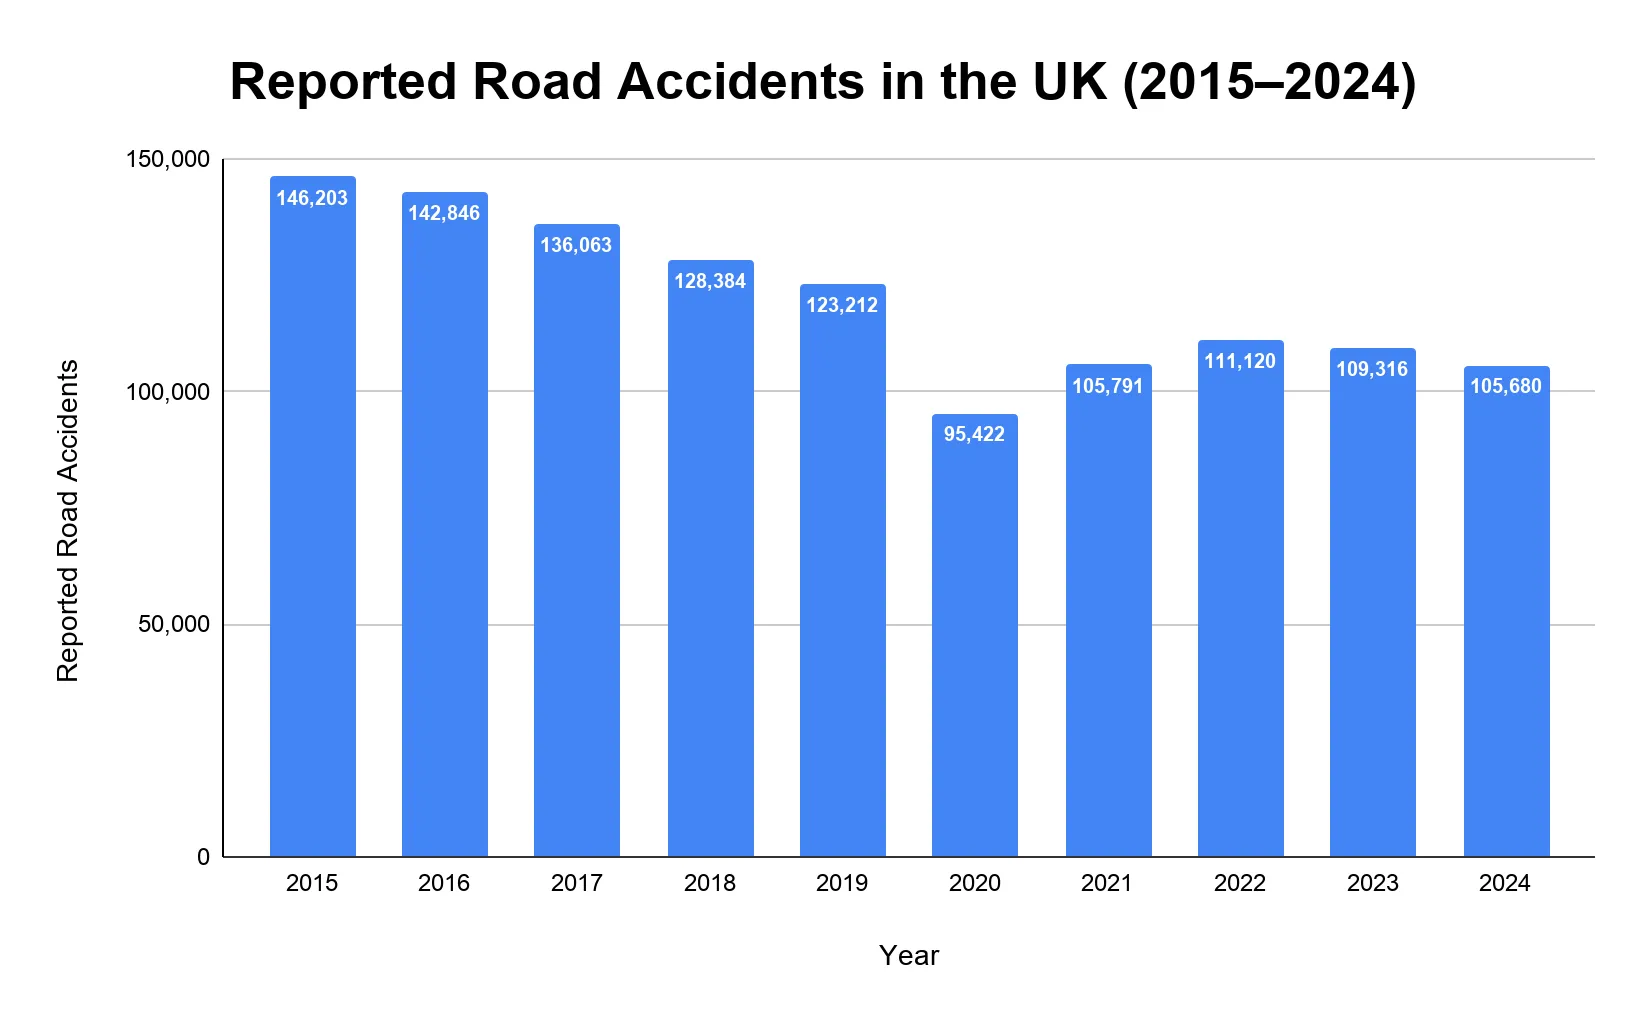
The total number of reported road accidents involving personal injury in the UK declined from 146,203 accidents in 2015 to 105,680 accidents in 2024.
- The UK recorded 123,212 reported accidents in 2019, before the pandemic reduced travel volumes.
- Reported accidents fell to 95,422 in 2020, a 22.6% drop from 2019.
- Accident numbers increased to 105,791 in 2021, as travel activity started to recover.
- The UK recorded 111,120 accidents in 2022 and 109,316 accidents in 2023.
- Reported accidents fell again to 105,680 in 2024, a 3.3% decrease from 2023.
What is the average number of car accidents per day/week/month in the UK?
- The UK experienced an average of about 290 reported road accidents per day, 2,032 per week, and 8,807 per month in 2024.
Note: Averages are calculated from 105,680 reported road accidents in 2024 divided by 365 days, 52 weeks, and 12 months.
How many vehicles were involved in car accidents?
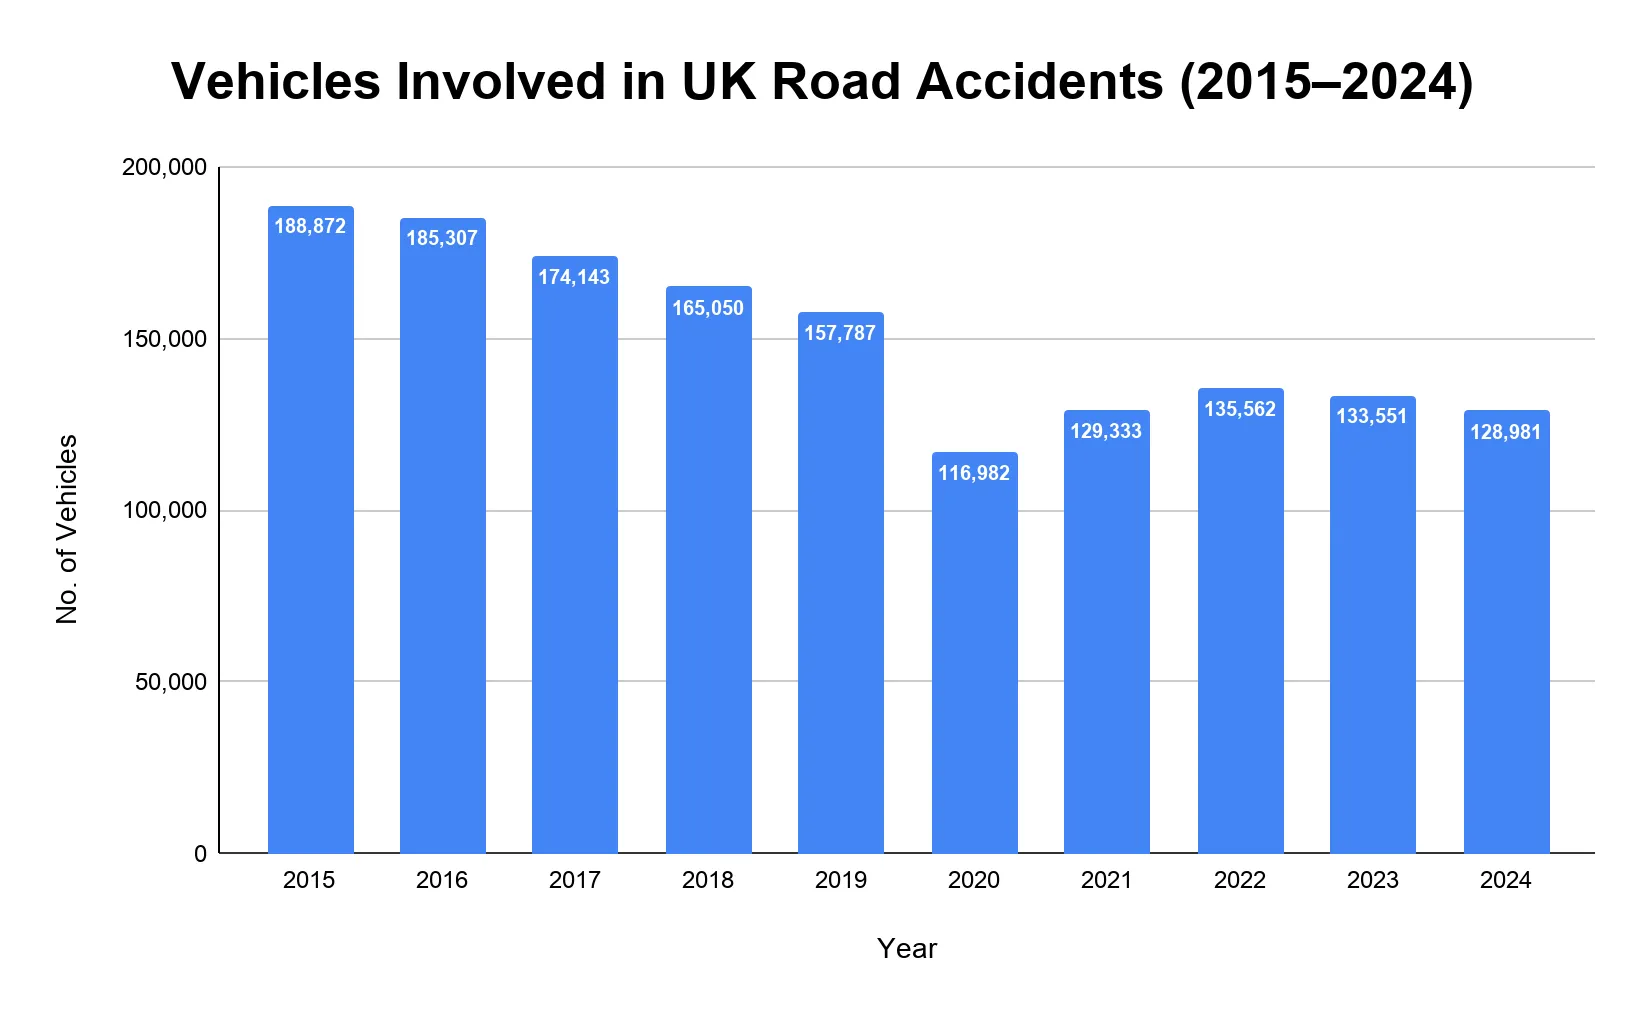
A total of 128,981 cars, taxis, and minibuses were involved in reported road accidents in Great Britain in 2024.
- Before the pandemic, 157,787 cars, taxis, and minibuses were involved in reported accidents in 2019.
- The number dropped to 116,982 in 2020 during the pandemic.
- Vehicle involvement increased to 129,333 in 2021 and 135,562 in 2022.
- The number fell to 133,551 in 2023 and 128,981 in 2024.
What are the most common causes of car accidents in the UK?
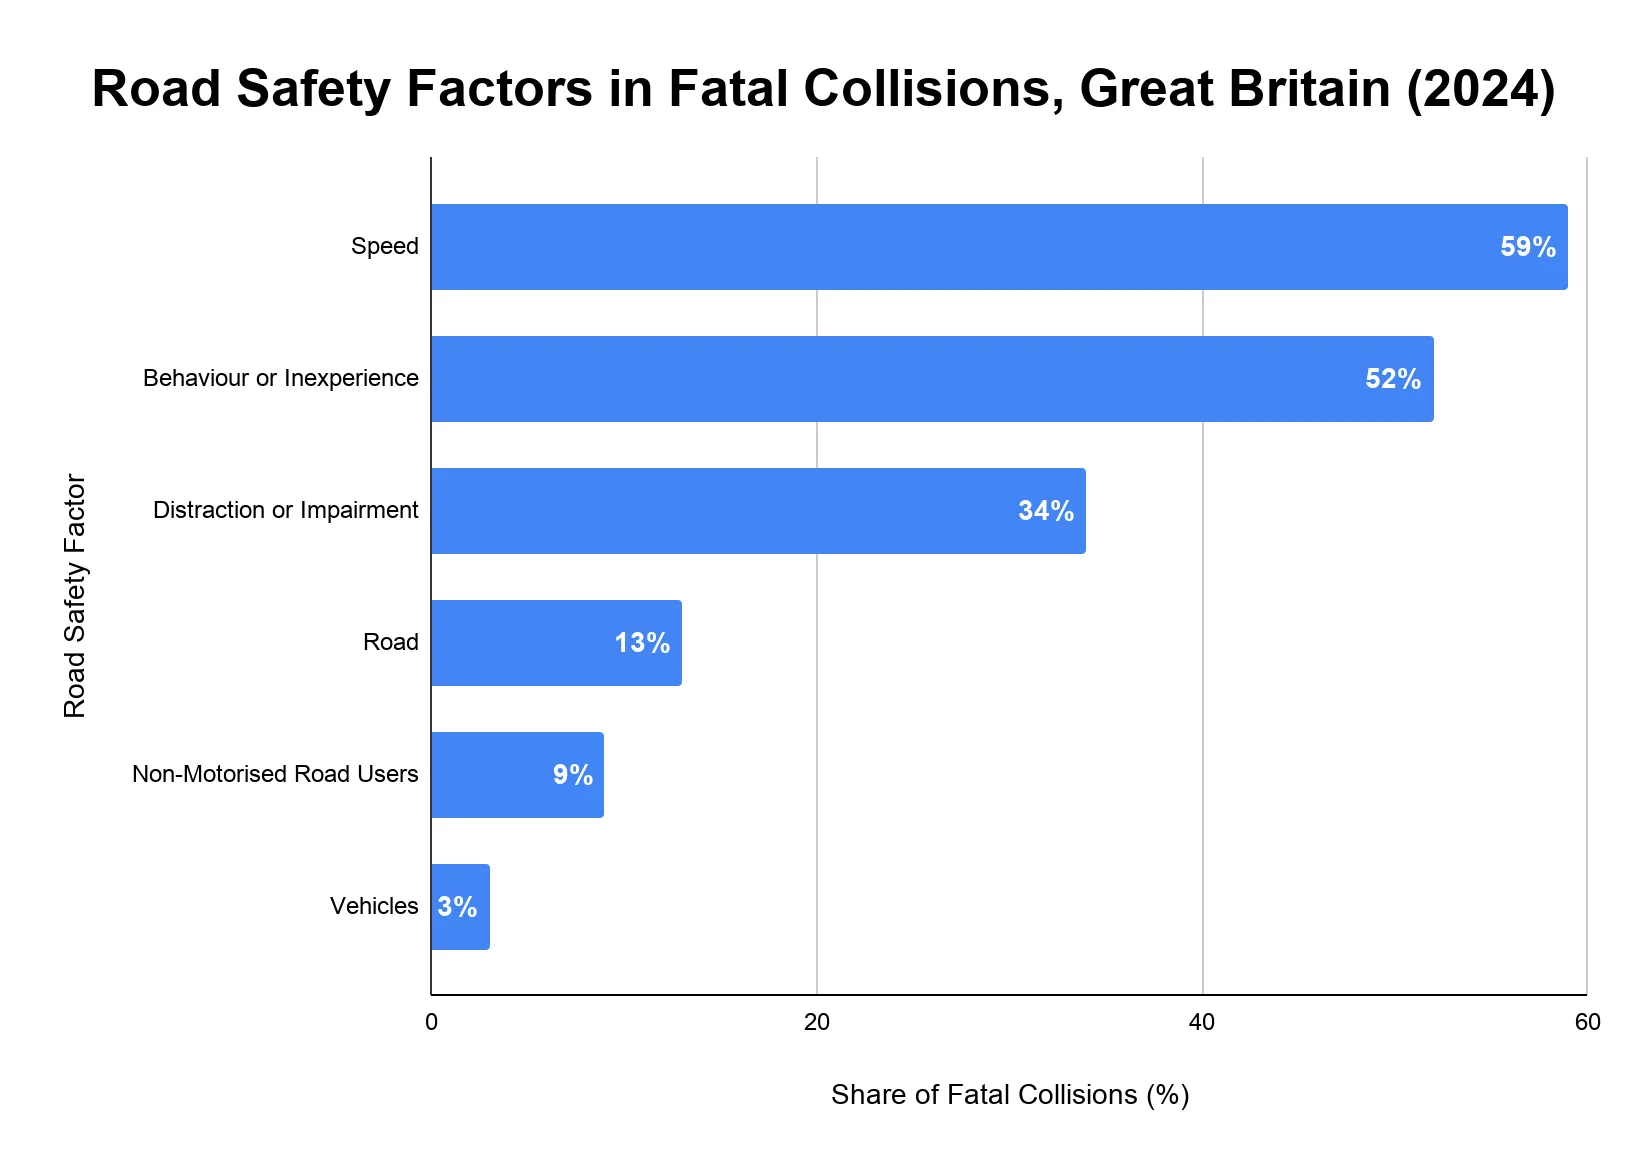
Speed was the most common road safety factor recorded in fatal collisions in Great Britain in 2024, appearing in 59% of fatal collisions with at least one factor assigned.
- Behaviour or inexperience was recorded in 52% of fatal collisions.
- Distraction or impairment was recorded in 34% of fatal collisions.
- Road-related factors were recorded in 13% of fatal collisions.
- Non-motorised road-user factors were recorded in 9% of fatal collisions.
- Vehicle-related factors were recorded in 3% of fatal collisions.
Demographic Profile of Car Accident Victims
Which age group is involved in the most car accidents?
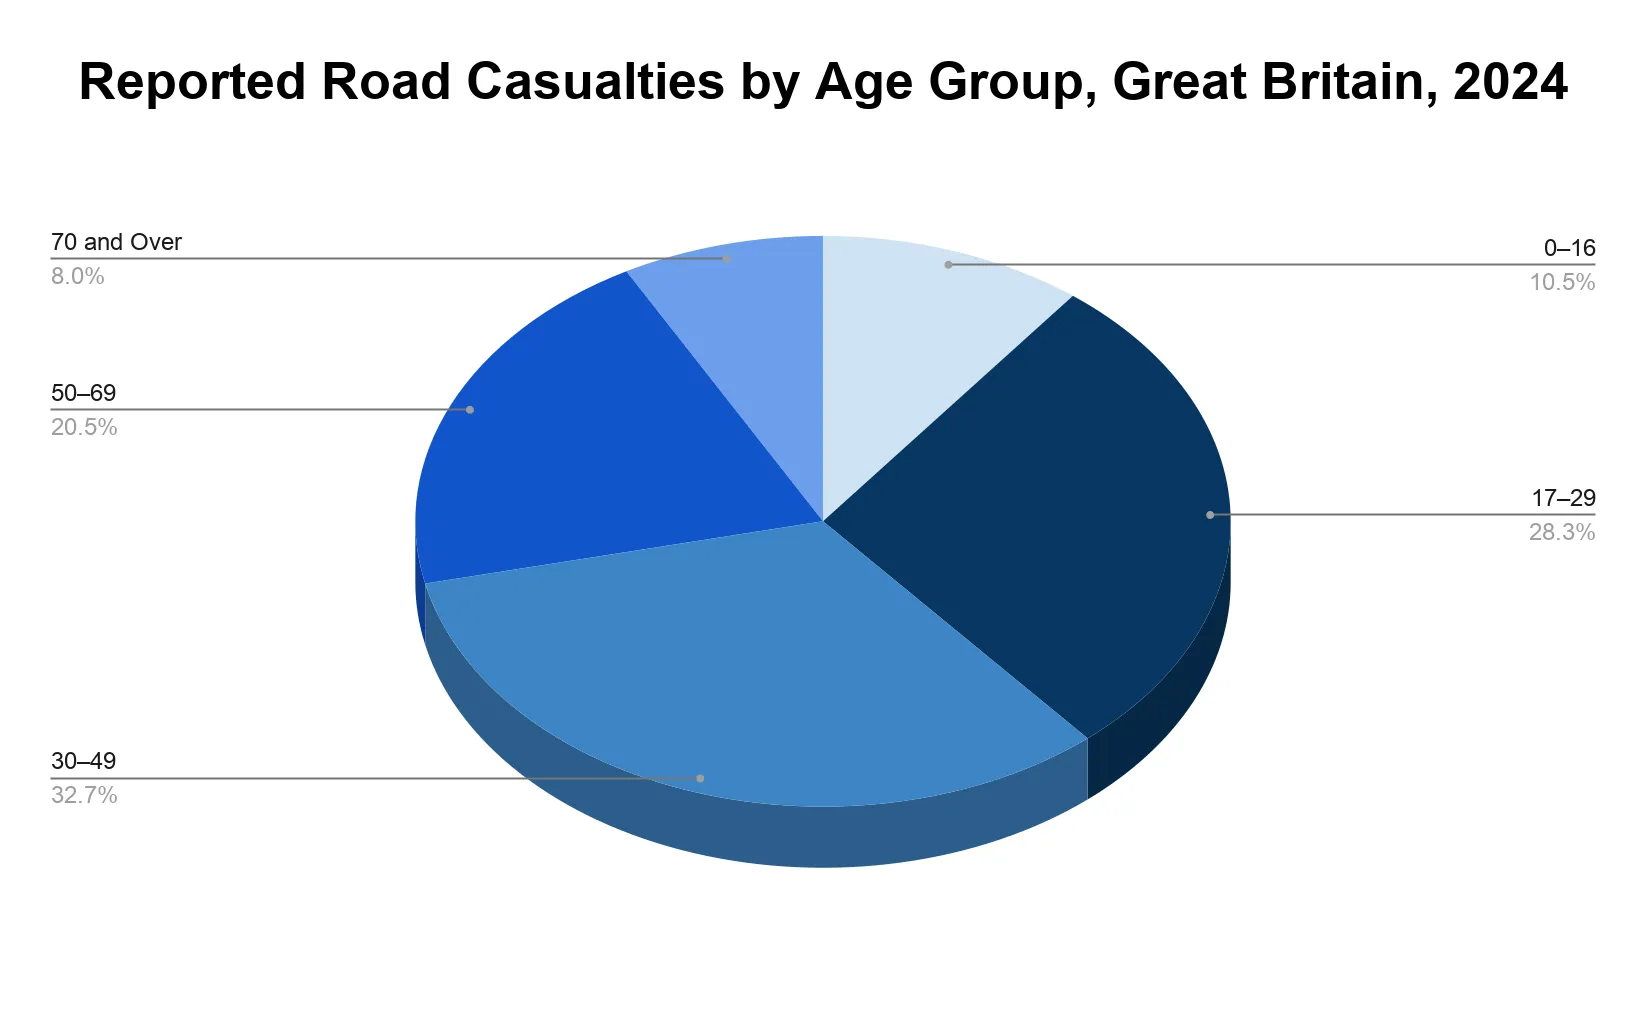
The 30–49 age group recorded the highest number of reported road casualties in Great Britain in 2024, with 40,870 casualties.
- The 17–29 age group followed with 35,271 casualties.
- The 50–69 age group recorded 25,584 casualties.
- Children and young people aged 0–16 accounted for 13,112 casualties.
- People aged 70 and over accounted for 9,999 casualties.
Who were the victims of car accidents in the UK?
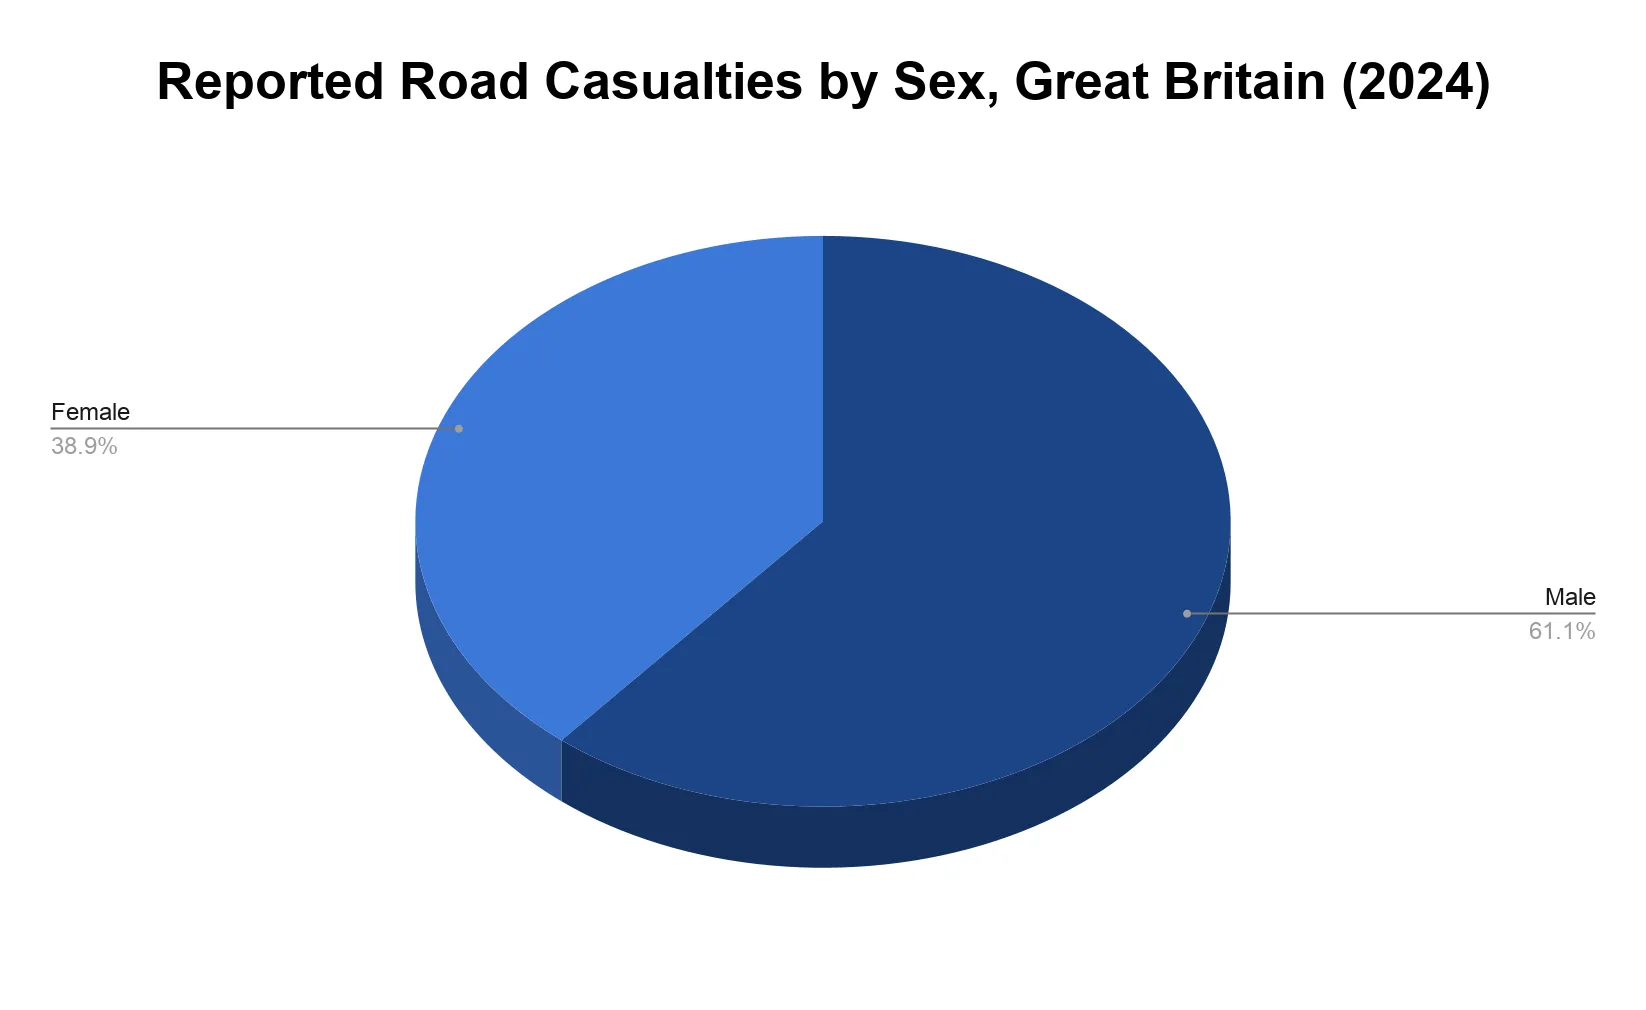
- Male casualties accounted for 61% of reported road casualties with recorded sex in Great Britain in 2024.
- The Department for Transport (DfT) recorded 77,456 male casualties and 49,356 female casualties in 2024.
- Female casualties accounted for 39% of reported road casualties with recorded sex.
- Male casualties were higher than female casualties across the reported age groups.
Which UK regions have the highest casualties from car accidents?
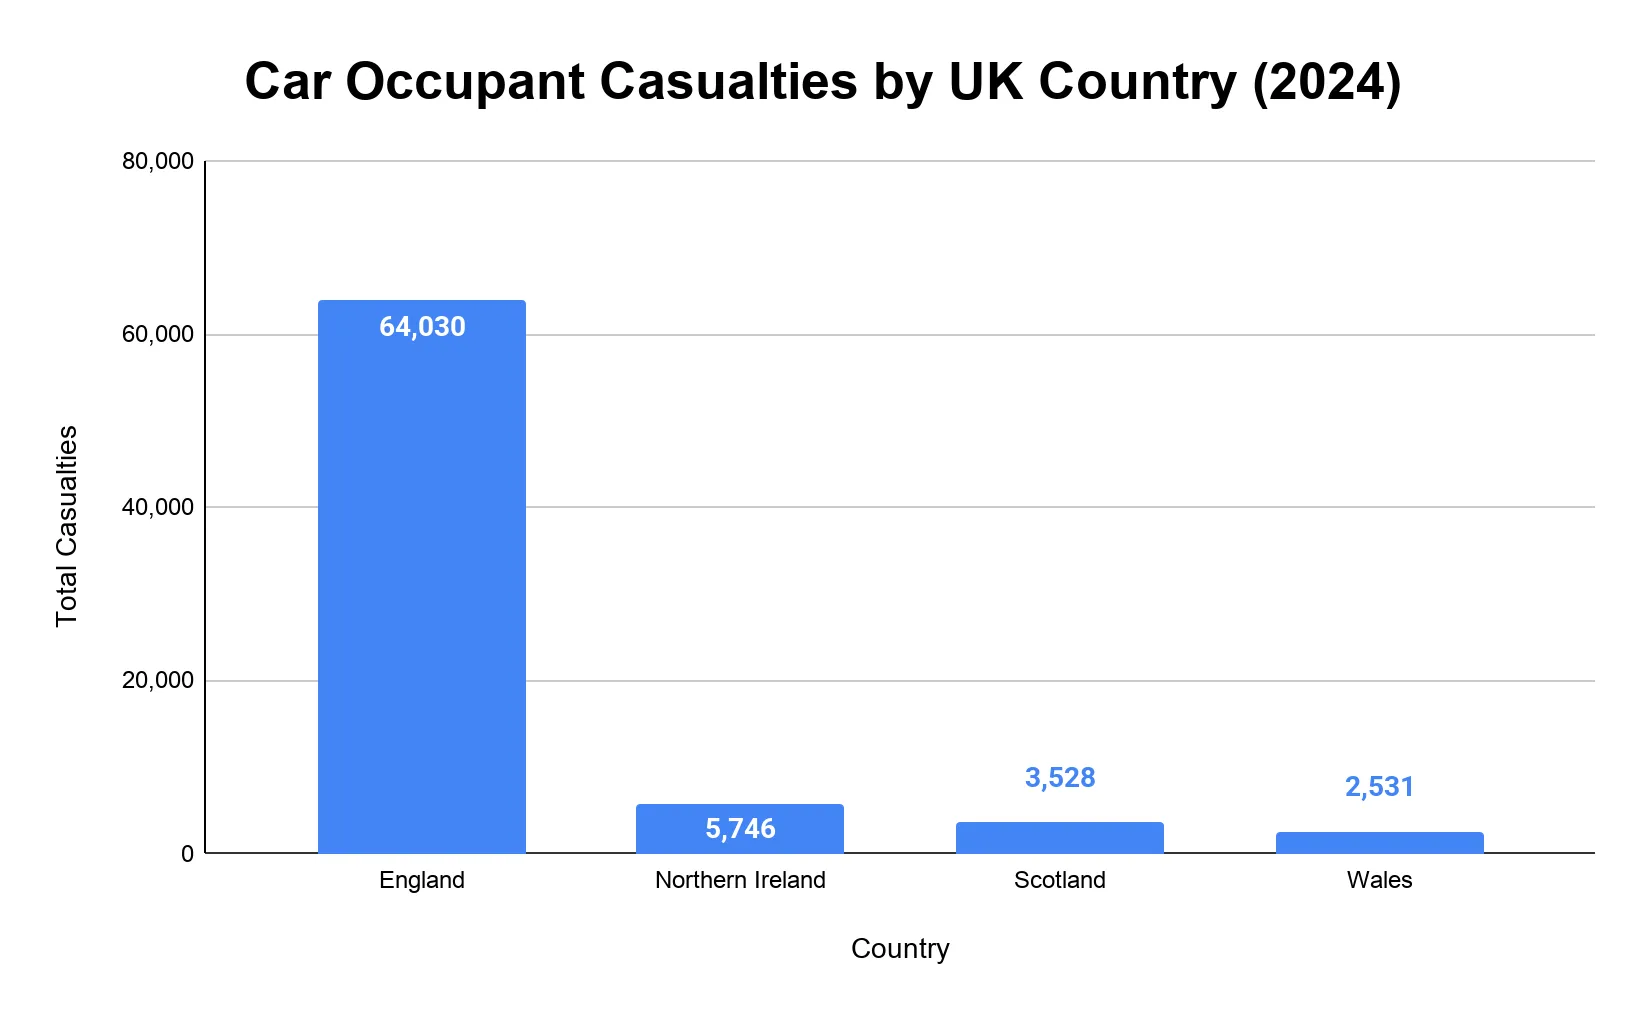
A total of 75,835 car occupant casualties were recorded in the UK in 2024, with England accounting for the highest number.
- England recorded 64,030 car occupant casualties in 2024, the highest among the UK countries.
- Northern Ireland recorded 5,746 car occupant casualties in the same year.
- Scotland recorded 3,528 car occupant casualties.
- Wales recorded 2,531 car occupant casualties.
Which types of roads see the most accidents in the UK?
- Urban roads accounted for 79,734 reported road casualties in Great Britain in 2024, the highest among road types.
- Rural roads recorded 43,479 casualties but accounted for 60% of road fatalities.
- Motorways recorded 5,055 casualties and accounted for 6% of road fatalities.
- Urban roads accounted for 62% of reported casualties, while rural roads accounted for 34%.
- Motorways carried 21% of road traffic but accounted for only 4% of casualties.
| Road Type | Reported Casualties | Casualty Share (%) | Fatality Share (%) |
|---|---|---|---|
| Urban Roads | 79,734 | 62% | 35% |
| Rural Roads | 43,479 | 34% | 60% |
| Motorways | 5,055 | 4% | 6% |
How many people have died in road accidents in the UK over the years?
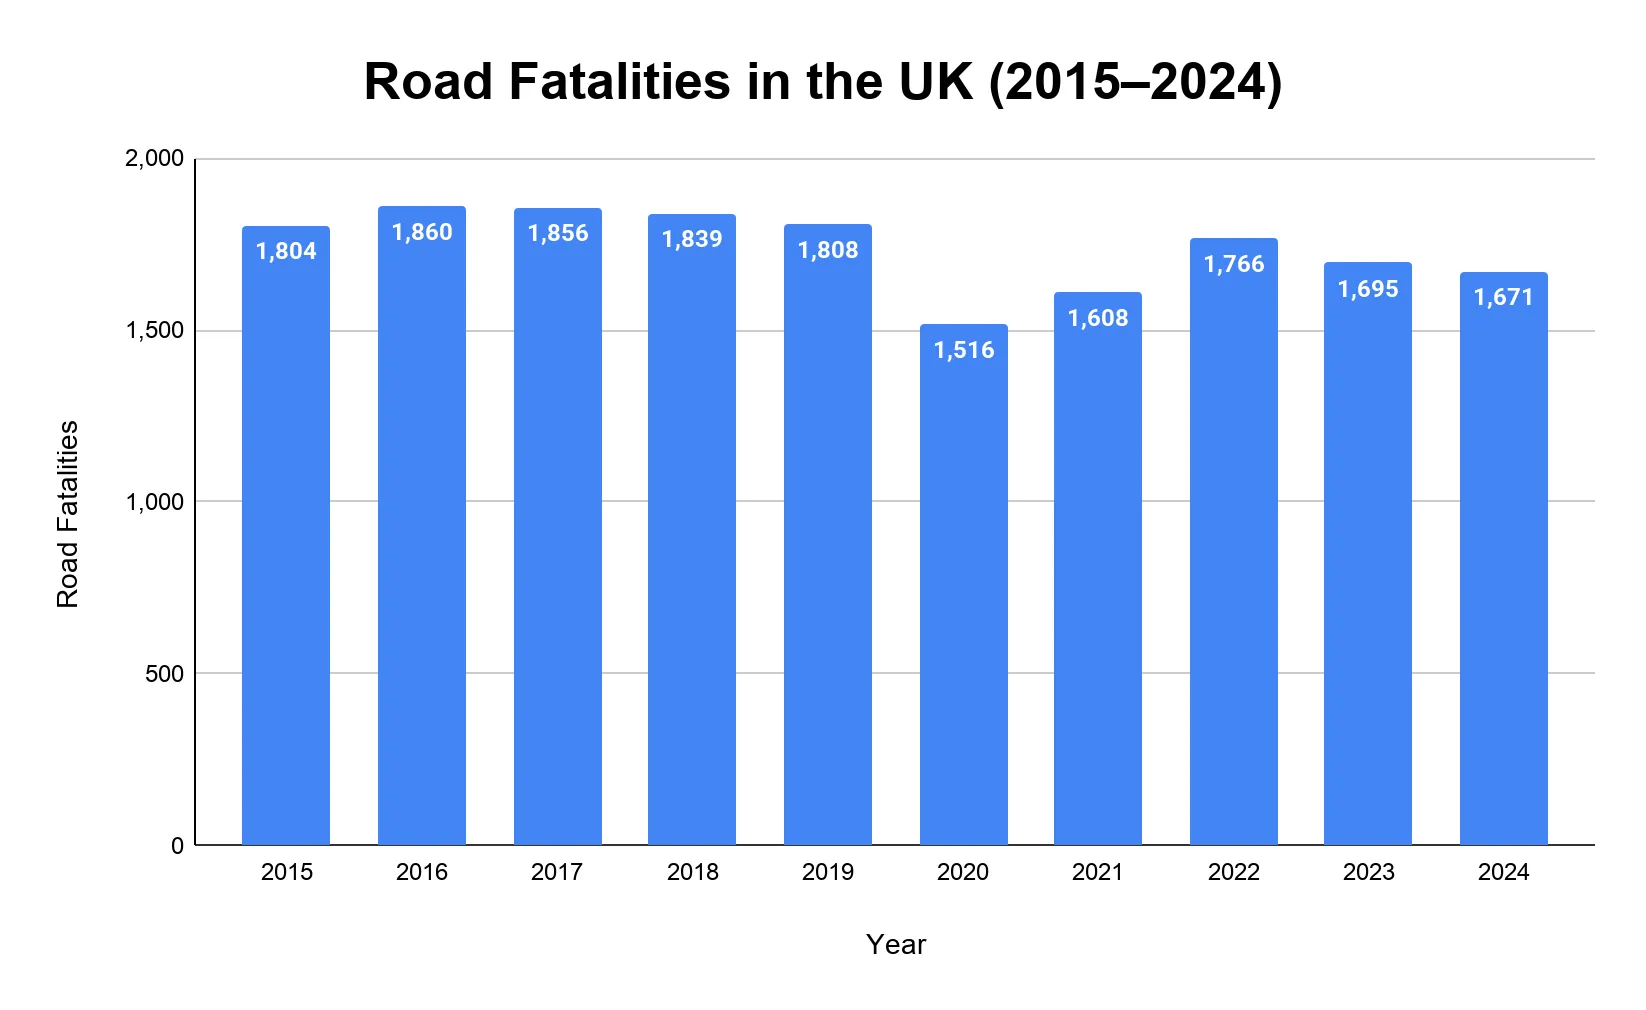
Reported road accidents resulted in 1,671 fatalities in the UK in 2024.
- UK road fatalities totalled 1,808 in 2019.
- The coronavirus disease 2019 (COVID-19) pandemic coincided with a drop to 1,516 fatalities in 2020, as travel activity decreased.
- Road fatalities increased to 1,608 in 2021 and 1,766 in 2022.
- Fatalities decreased to 1,695 in 2023.
- The UK recorded 1,671 road fatalities in 2024, a 1.4% decrease from 2023.
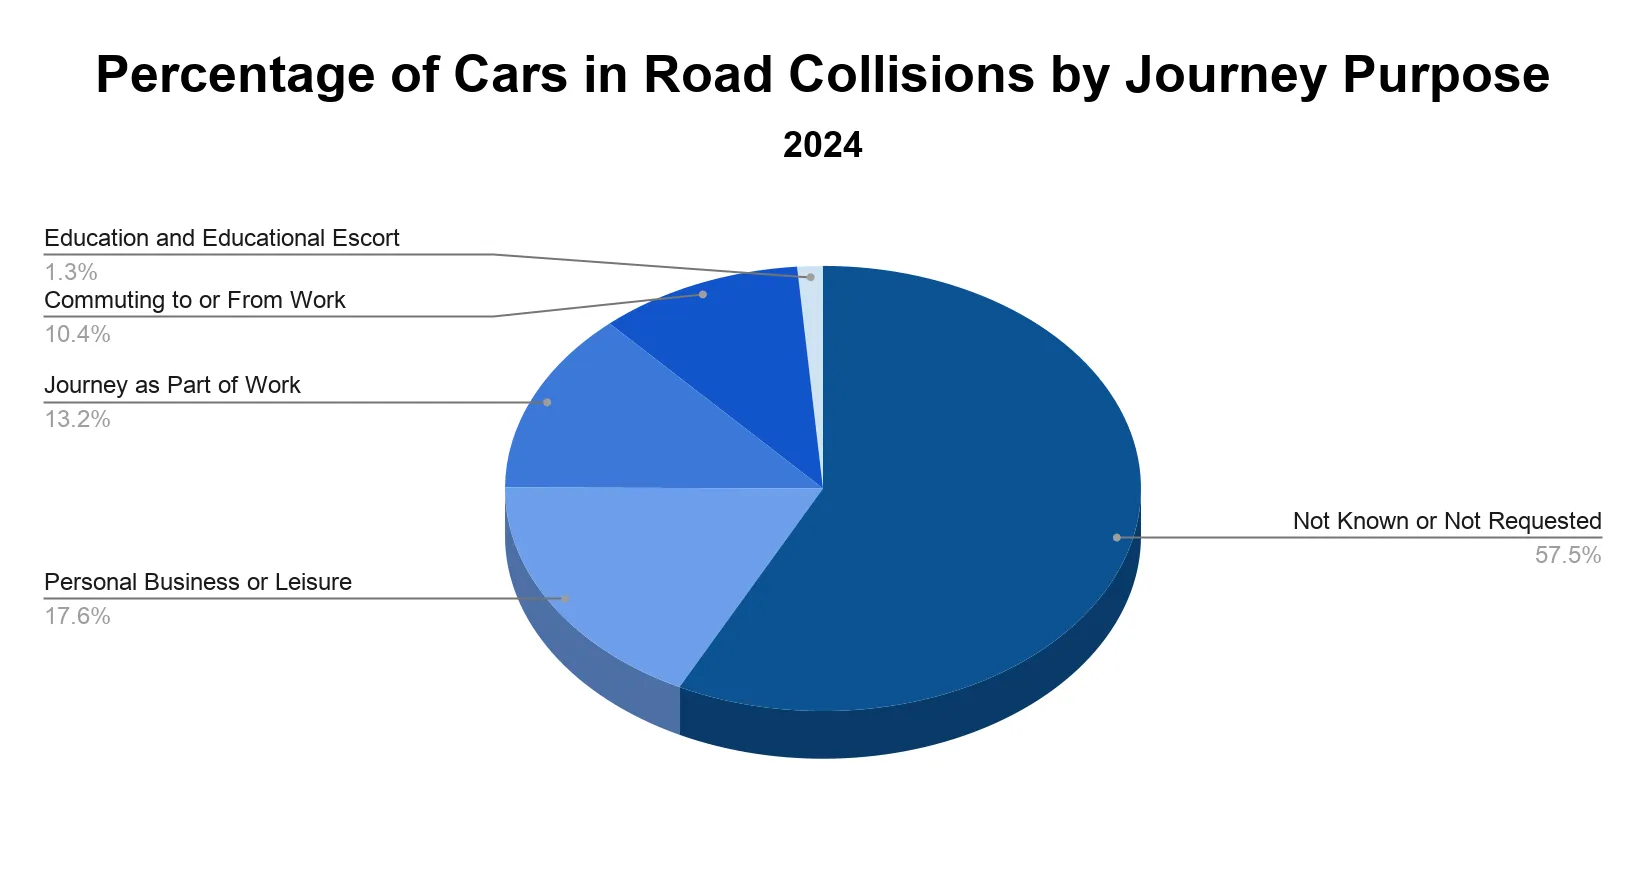
What was the journey purpose of vehicles involved in road accidents?
Among motor vehicles involved in reported road accidents in Great Britain in 2024, 57.4% had a journey purpose that was not known or not requested.
- 17.6% of motor vehicles involved were on personal business or leisure journeys.
- 13.2% were on journeys as part of work.
- 10.4% were commuting to or from work.
- 1.3% were on education or educational escort journeys.
Vehicle and Technology
What types of cars are most commonly involved in accidents?
Petrol-powered cars were the most commonly defined propulsion type among cars involved in reported accidents in Great Britain in 2024, with 56,083 vehicles involved.
- Diesel cars followed with 34,098 vehicles involved.
- Hybrid electric cars accounted for 10,644 vehicles involved.
- Electric cars accounted for 3,271 vehicles involved.
- Another 24,453 cars had undefined propulsion types.
| Cars Involved in Reported Collisions by Propulsion Type Data (2024) | |
|---|---|
| Propulsion Type | Cars Involved |
| Petrol | 56,083 |
| Diesel | 34,098 |
| Hybrid Electric | 10,644 |
| Electric | 3,271 |
| Electric Diesel | 345 |
| Gas | 87 |
| Other | 0 |
| Fuel Cells | 0 |
| Undefined | 24,453 |
| All Propulsion Types | 128,981 |
Source · Note: The table counts cars involved in reported accidents by propulsion type. It should not be read as a risk ranking because it does not adjust for how many vehicles of each propulsion type are on the road.
More Statistics
- Auto Industry Trends and Statistics
- BMW Car Sales Statistics
- Ford Car Sales Statistics
- Hyundai Sales Statistics
- Nissan Car Sales Statistics
- Top-Selling Car Manufacturers
- Best-Selling Car Models
- Car Sales in Canada
- Car Sales in Germany
- Cars Statistics
- Tesla Model Y Sales Statistics
- Volkswagen Car Sales Statistics
How many accidents involve drivers under the influence of alcohol or drugs?
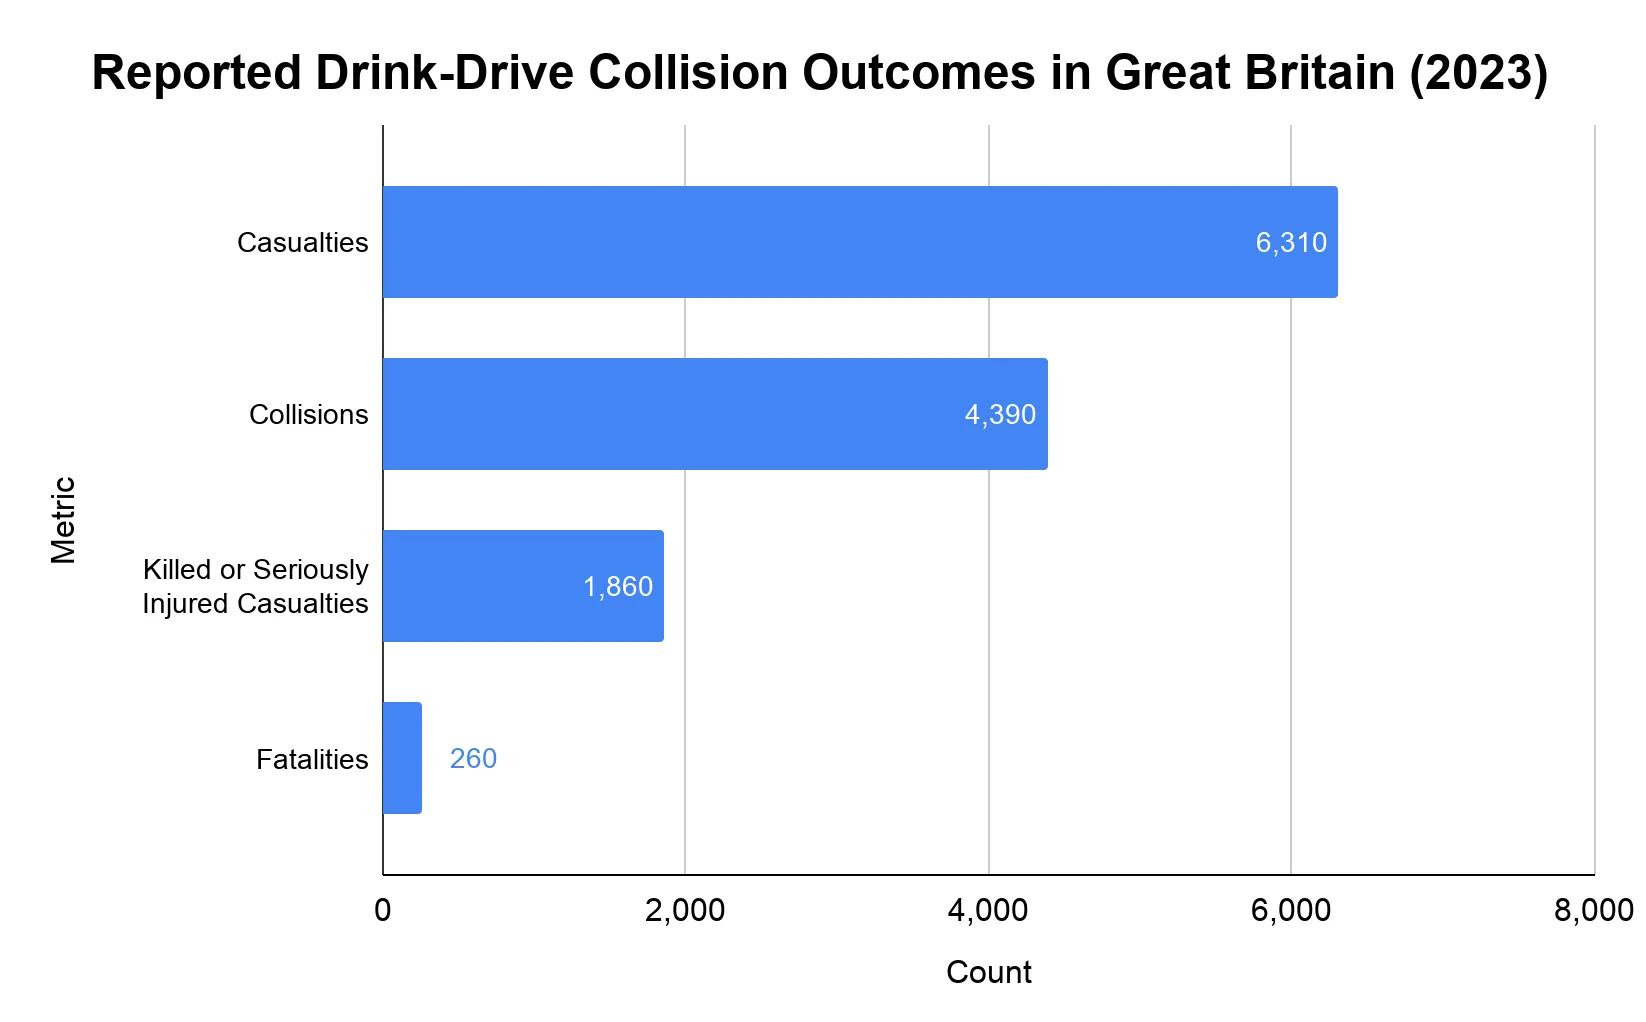
The latest final DfT drink-driving statistics show 4,390 drink-drive collisions in Great Britain in 2023.
- Drink-drive collisions resulted in 6,310 casualties in 2023.
- An estimated 260 fatalities occurred in drink-drive collisions in 2023.
- Drink-drive collisions accounted for 4% of all reported road collisions.
- Separate Fatal 4 analysis found 282 fatal collisions with at least one drink or drug-related factor assigned in 2023.