

 Popular Countries
 24/7 Support
Published
Auckland Airport (AKL) is New Zealand’s main international gateway and the busiest airport in the country, handling nearly 19 million passengers a year. Located 21 km south of central Auckland, it connects travelers to 42 international destinations across the Pacific, Asia and the Americas, while maintaining extensive domestic services across New Zealand.
How many passengers pass through Auckland Airport each year?
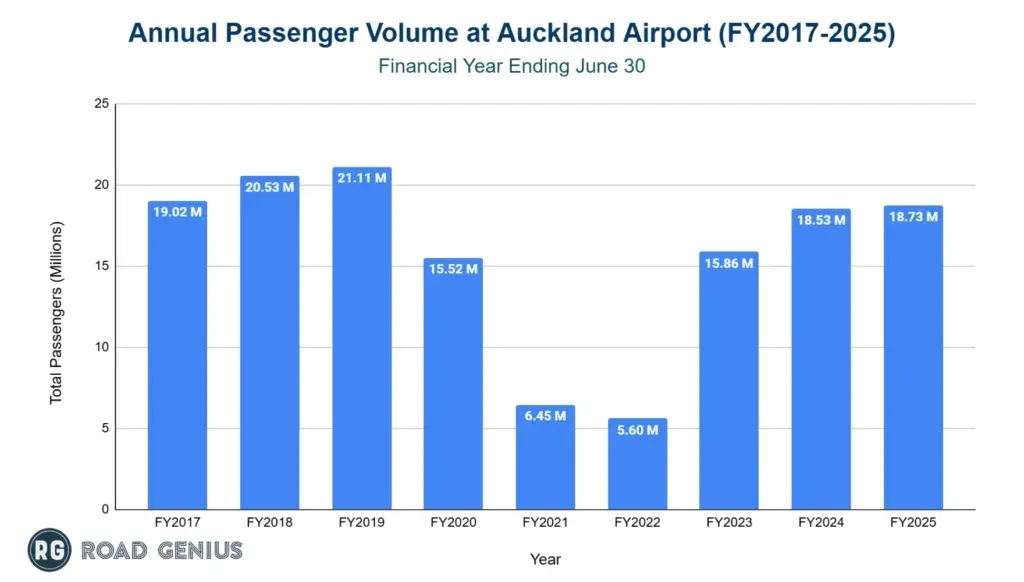
Auckland Airport handles over 18 million passengers annually, showing a strong recovery from pandemic impacts and continuing progress toward pre-pandemic levels.
- AKL processed 18.73 million passengers in FY2025, a 1.1% increase from 18.53 million in FY2024.
- The airport reached a record 21.11 million passengers in FY2019 before COVID-19 caused a dramatic drop in traffic.
- Passenger numbers fell to 6.45 million in FY2021 and 5.6 million in FY2022, the lowest levels in decades during border closures.
- Recovery accelerated with 15.9 million passengers in FY2023, followed by continued growth in FY2024 and FY2025.
Annual Passenger Volume at Auckland Airport (FY2017-2025)
How many Domestic vs International Travelers does Auckland Airport serve?
Auckland Airport maintains a relatively balanced passenger profile with a slight international majority, although domestic market constraints limit further growth.
- International passengers accounted for 55% of total traffic in FY2025, with 10.31 million travelers including transit passengers.
- Domestic passengers made up 45%, with 8.43 million travelers on routes across New Zealand.
| Passenger Movements: Domestic vs International (FY2020-2025) | ||
|---|---|---|
| Year | Domestic | International |
| FY2020 | 7.05 M | 8.47 M |
| FY2021 | 5.85 M | 0.60 M |
| FY2022 | 4.26 M | 1.34 M |
| FY2023 | 8.09 M | 7.77 M |
| FY2024 | 8.47 M | 10.06 M |
| FY2025 | 8.43 M | 10.31 M |
What is the total number of aircraft operations at Auckland Airport each year?
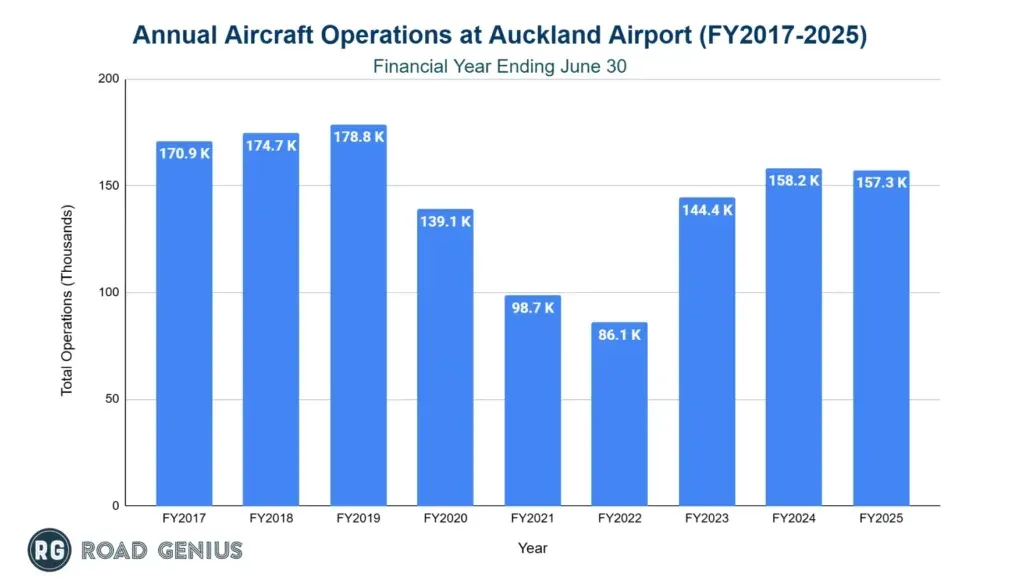
Auckland Airport records over 150,000 aircraft movements annually.
- 157,348 aircraft movements occurred in FY2025, compared to 158,185 in FY2024, indicating stabilization at current capacity.
- In FY2020, the airport recorded 139,134 movements, before a sharp decline during the border restrictions during COVID.
- Aircraft movements dropped to 98,684 in FY2021, then further declined to 86,063 in FY2022 during the height of the pandemic.
- Recovery gained pace with 144,421 movements in FY2023, continuing to present levels.
Annual Aircraft Operations at Auckland Airport (FY2017-2025)
Domestic vs International Operations
Auckland Airport has a heavily domestic-focused operation profile, with domestic flights accounting for more than 60% of total aircraft movements.
- Domestic operations totaled 105,169 movements in FY2025, making up 66.8% of total flight activity.
- International operations recorded 52,179 movements in FY2025, or 33.2% of the total.
| Aircraft Movements: Domestic vs International (FY2020-2025) | ||
|---|---|---|
| Year | Domestic | International |
| FY2020 | 94,174 | 44,960 |
| FY2021 | 83,582 | 15,102 |
| FY2022 | 67,748 | 18,315 |
| FY2023 | 101,998 | 42,423 |
| FY2024 | 105,161 | 53,024 |
| FY2025 | 105,169 | 52,179 |
Auckland Airport Latest Statistics (1st Half of FY 2026)
- In the first half of FY 2026 (July 2025 – December 2025), Passenger traffic climbed 2% year-on-year to 9.64 million.
- Domestic and international segments both recorded 2% growth, reaching 4.37 million and 5.27 million, respectively.
- Revenue rose to $519.6 million, marking a 4% increase.
- Excluding interest income, revenue growth strengthened to 6%, totaling $512.5 million.
Which airlines operate the most flights out of Auckland Airport?
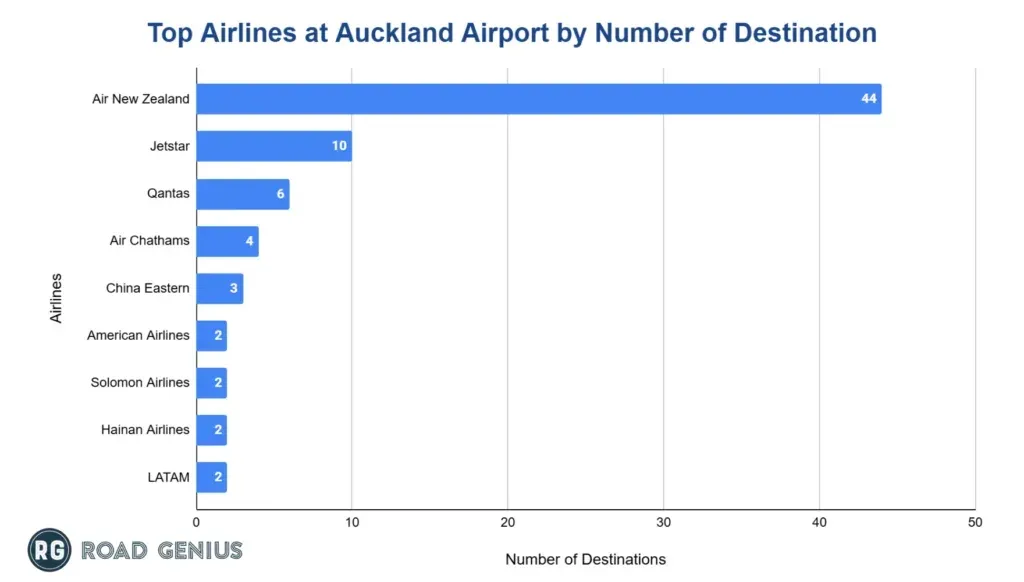
Air New Zealand is the dominant operator at Auckland Airport, serving both domestic and international routes.
- Air New Zealand serves 44 destinations from Auckland.
- Jetstar follows with 10 destinations, while Qantas serves 6 destinations.
- Air Chathams and China Eastern connect to 4 and 3 destinations respectively.
Top Airlines at Auckland Airport by Number of Destination
What are the monthly trends in passenger traffic at Auckland Airport?
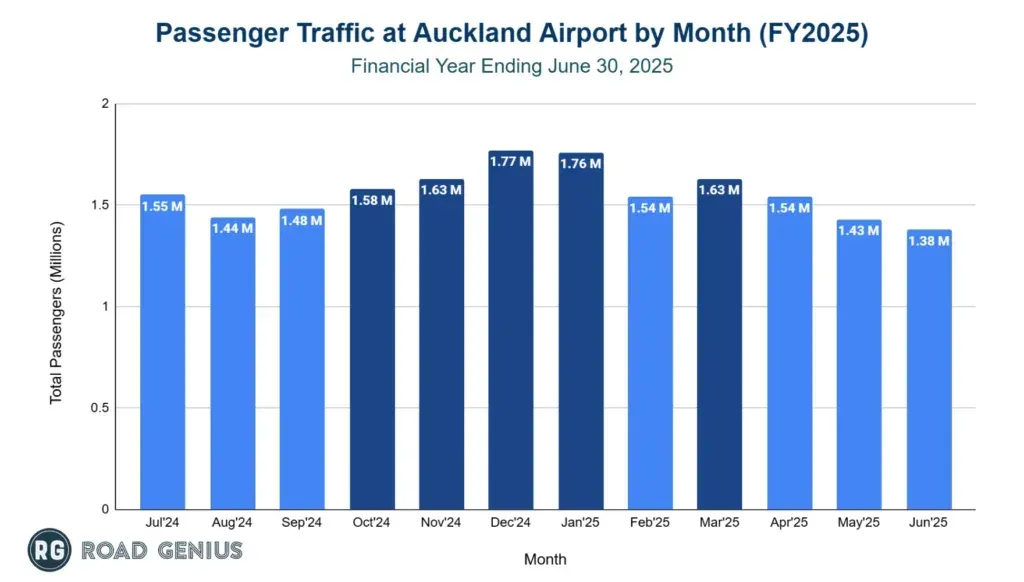
Auckland Airport consistently handles over 1 million passengers per month.
- December 2024 and January 2025 were the busiest months, with 1.77 million and 1.76 million passengers, respectively
- November 2024 and March 2025 each recorded 1.63 million passengers
- June 2025 had the lowest volume at 1.38 million passengers, followed by May 2025 with 1.43 million.
Passenger Traffic at Auckland Airport by Month (FY2025)
How many routes are there at Auckland Airport?
Auckland Airport serves 65 destinations through its domestic and international networks, reflecting near-full restoration of pre-COVID connectivity.
- 42 international destinations across the Pacific, Asia, North America and the Middle East.
- 23 domestic destinations across both the North and South Islands of New Zealand.
- 28 airlines operate from Auckland, reflecting a broad mix of carriers.
- Seasonal route availability changes throughout the year. This is especially noticeable during the Northern Hemisphere summer (June–August), when many international airlines adjust their schedules based on peak travel demand in their home markets, affecting long-haul routes to New Zealand.
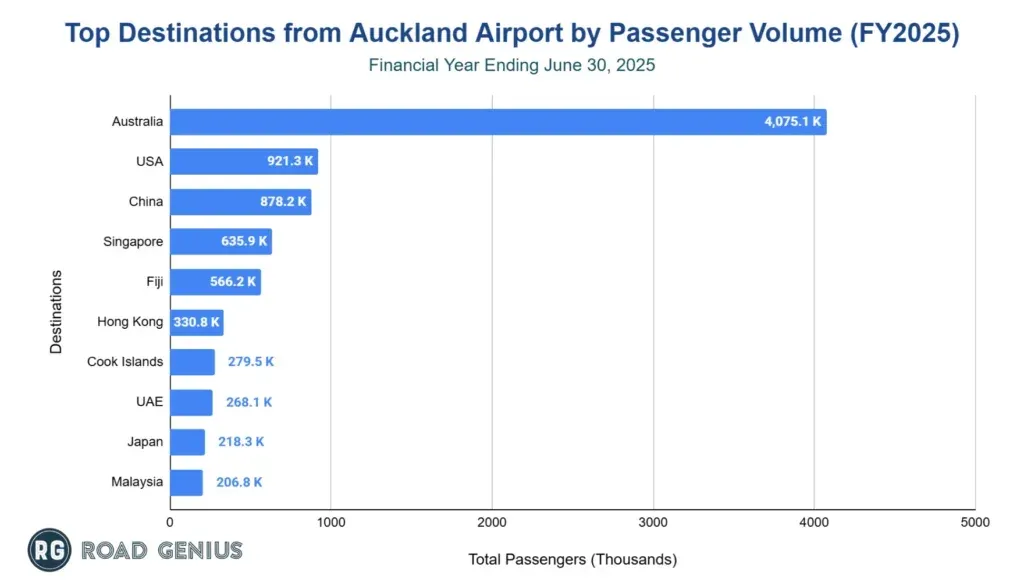
Which destinations are the most popular from Auckland Airport?
Trans-Tasman routes to Australia remain the most heavily traveled from Auckland Airport.
- Australia was the top international destination in FY2025 with 4.08 million passengers.
- The United States followed with 921,275 travelers.
- China ranked third with 878,204 passengers.
- Singapore had 635,915 passengers.
- Fiji rounded out the top five with 566,210 passengers.
Top Destinations from Auckland Airport by Passenger Volume (FY2025)
How much cargo does Auckland Airport import annually?
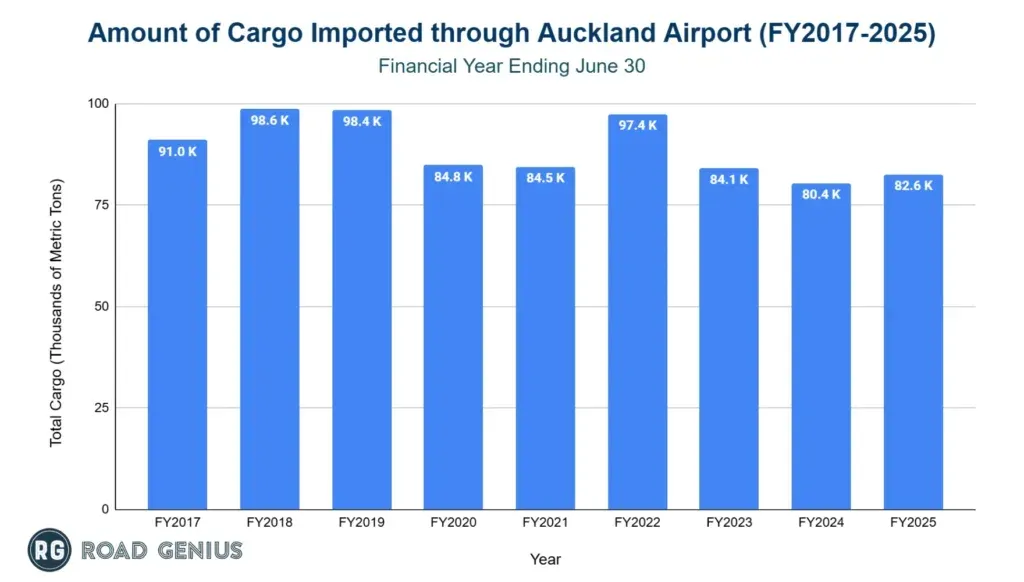
Auckland Airport handles over 80,000 metric tons of imported cargo per year, reinforcing its role as New Zealand’s primary air freight hub.
- 82,573 metric tons were imported in FY2025, up from 80,408 metric tons in FY2024.
- FY2025 volumes align with FY2020 (84,751 metric tons) and FY2021 (84,487 metric tons).
- FY2022 had the highest recent volume with 97,419 metric tons, followed by a decline to 84,104 metric tons in FY2023.
Amount of Cargo Imported through Auckland Airport (FY2017-2025)
How much revenue has Auckland Airport generated each year?
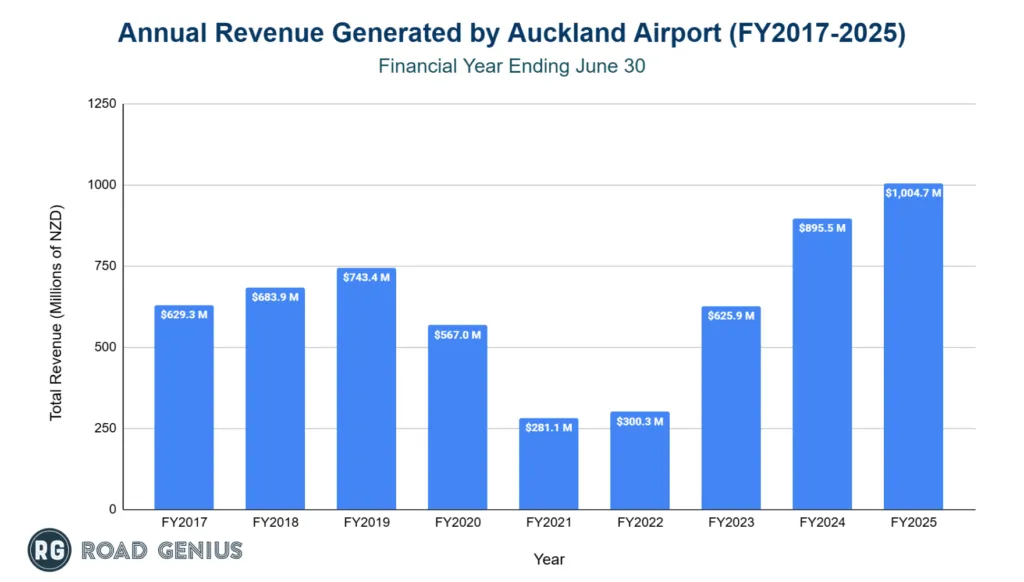
Auckland Airport has shown strong financial recovery, with revenue reaching record highs in FY2025, driven by both aviation and non-aviation sources.
- FY2025 revenue reached NZD 1.005 billion, up 12% from FY2024.
- NZD 895.5 million was recorded in FY2024, continuing a strong upward trend.
- Pre-pandemic, the airport earned NZD 743.4 million in FY2019.
- Revenue rebounded from a low of NZD 281.1 million in FY2021, rising to NZD 300.3 million in FY2022 and NZD 625.9 million in FY2023.
Annual Revenue Generated by Auckland Airport (FY2017-2025)
What are the main causes of flight disruptions at Auckland Airport?
Flight delays and cancellations at Auckland Airport are mostly driven by weather and operational issues.
- Severe weather, especially high winds and heavy rain, often halts ground operations.
- Late-arriving aircraft are the most frequent cause of delays, per on-time performance reports.
- Air New Zealand’s fleet and engine maintenance challenges reduce operational flexibility.
- Flooding in January 2023 forced an international terminal closure, causing major disruptions and $8.4 million in damages.
- Wind speeds over 115 km/h have led to as many as 65 flight cancellations during extreme weather events.
More Statistics
What are notable incidents at Auckland Airport?
- 17 February 1979: Air New Zealand Flight 4374 crashed into Manukau Harbour on final approach, killing one crew member and one company employee.
- 31 July 1989: An Air Freight NZ Convair 340/580 crashed shortly after takeoff, killing all three crew members.
- 12 March 2003: Singapore Airlines Flight 286 experienced a 490-meter tail strike due to a thrust miscalculation caused by a 100-tonne error in the aircraft’s takeoff weight.
Other Relevant Facts Related to Auckland Airport
- Auckland Airport is the largest and busiest airport in the country.
- The airport covers a 1,500 hectare (5.8 sq. miles) area.
- The airport has a single 3,635 m (11,926 ft) runway (05R/23L).
- The airport has an international and domestic terminal.
References
- Auckland Airport — operational data (corporate site) · corporate.aucklandairport.co.nz
- FlightConnections — airlines flying from Auckland Airport (AKL) · flightconnections.com
- Figure.NZ — cargo volume imported through Auckland Airport · figure.nz
- Aviation Safety Network — Notable Incidents at Calgary Airport · asn.flightsafety.org

