

 Popular Countries
 24/7 Support
Published
Queenstown Airport (ZQN) is New Zealand’s fourth busiest airport and the main international gateway to the Southern Lakes region. Located in a mountain valley, this council-controlled trading organization is majority-owned by Queenstown Lakes District Council (75.01%) and Auckland International Airport Limited holds a 24.99% strategic stake.
How many passengers pass through Queenstown Airport each year?
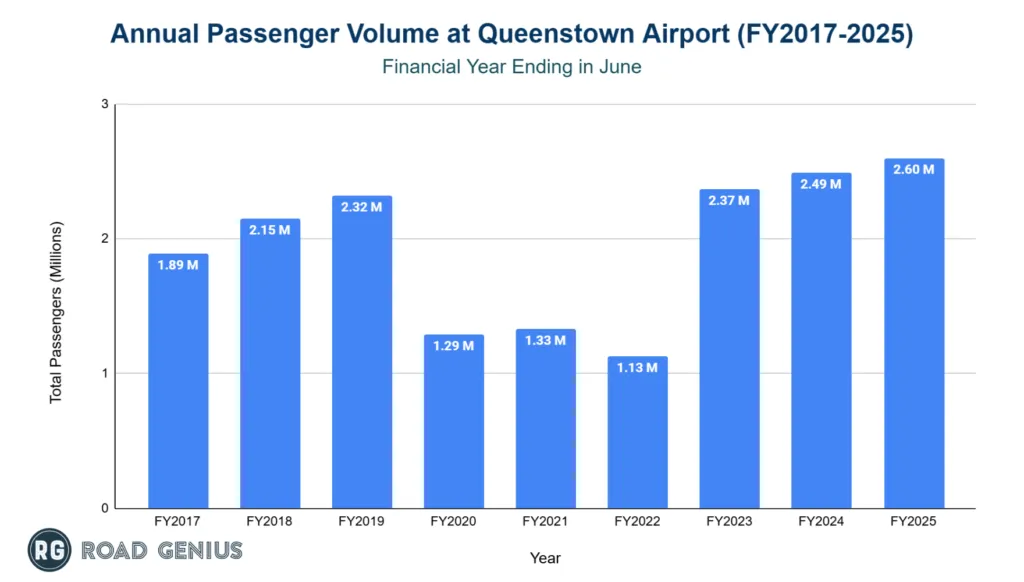
Queenstown Airport handles over 2 million passengers annually, setting new records as it rebounds strongly after the pandemic.
- ZQN processed 2.6 million passengers in the year ending June 2025 (FY2025), a 4.4% increase compared to the previous year.
- The airport surpassed its pre-pandemic peak of 2.32 million passengers recorded in FY2019.
- Passenger numbers dropped to 1.13 million in FY2022 when international borders remained closed for 330 days.
- Recovery gained momentum, rising from 2.37 million in FY2023 to 2.49 million in FY2024.
Domestic vs International Travelers
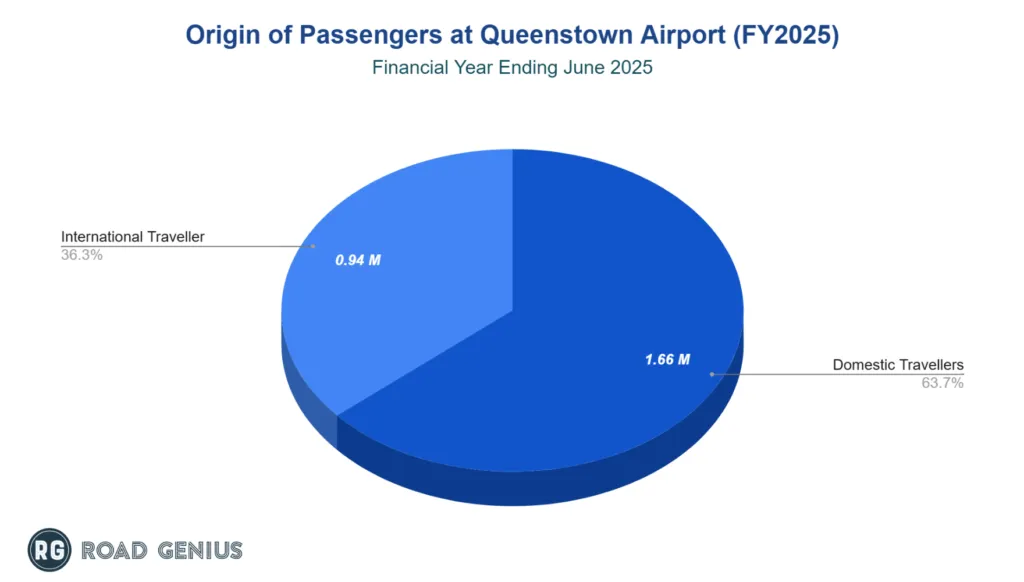
Queenstown Airport has a predominantly domestic traveler base, though international traffic has been key to recent growth.
- Domestic passengers made up 63.7% of total traffic in FY2025, with 1.66 million travelers.
- International passengers accounted for 36.3%, totaling 944,225 travelers.
- International traffic grew by 10% in FY2025 while domestic traffic rose by 2%.
What is the total number of aircraft operations at Queenstown Airport each year?
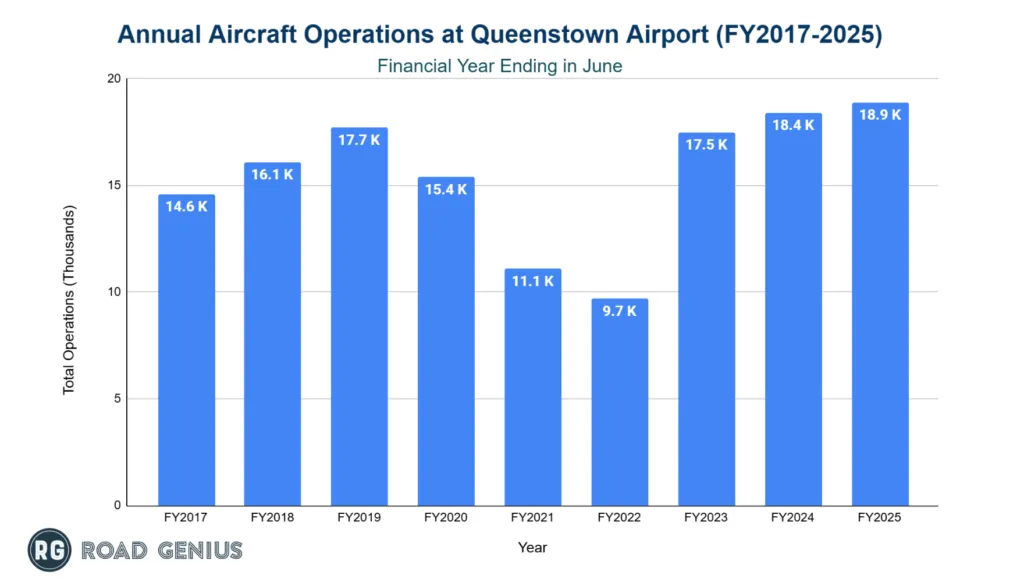
Queenstown Airport records over 15,000 scheduled aircraft movements annually, with steady growth following pandemic disruptions.
- There were 18,865 scheduled aircraft movements in FY2025, a 2.6% increase from the previous year.
- In FY2019, movements reached 17,736 before the onset of the pandemic.
- Numbers declined to 15,405 in FY2020, then to 11,061 in FY2021.
- FY2022 saw the lowest figure in over a decade with just 9,734 movements due to international flight suspensions.
- The airport recovered to 18,388 movements in FY2024, a 5.0% increase from 17,512 in FY2023.
Queenstown Airport Latest Statistics (1st Half of FY 2026)
- In the first half of FY 2026 (July 2025 – December 2025), Passenger traffic climbed 9% year-on-year to 1.46 million.
- Revenue rose to $43.6 million, marking an 8% increase.
Which airlines operate the most flights out of Queenstown Airport?
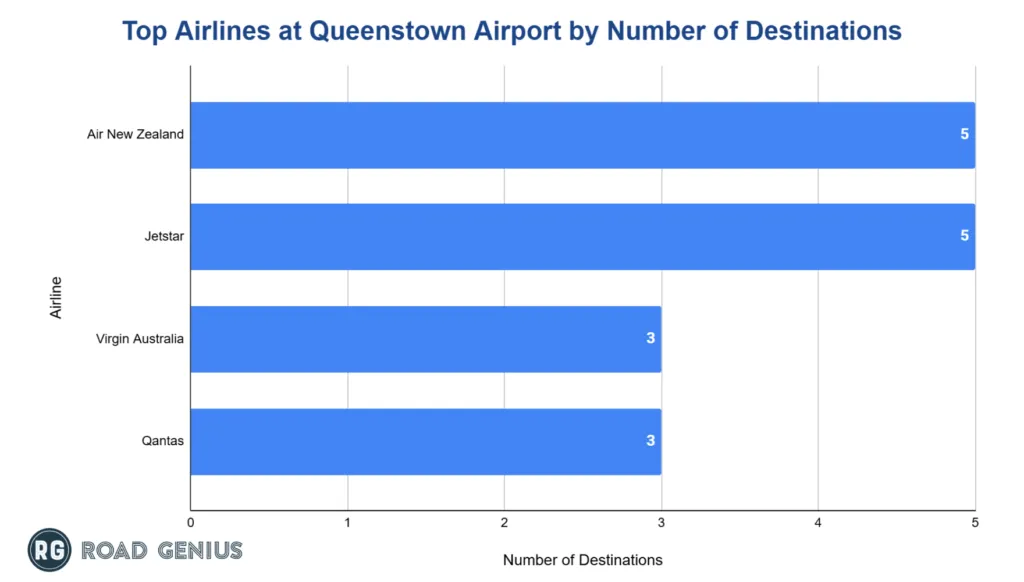
Four major airline groups operate at ZQN: Air New Zealand, Jetstar, Qantas and Virgin Australia.
- Air New Zealand and Jetstar each serve 5 destinations from Queenstown.
- Virgin Australia and Qantas connect to 3 destinations each.
What are the monthly or seasonal trends in passenger traffic at Queenstown Airport?
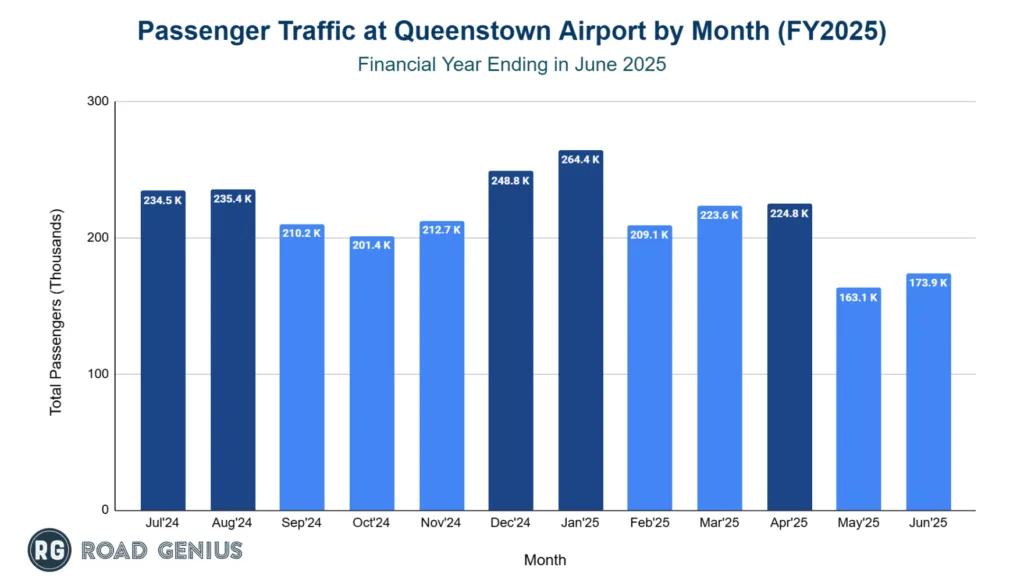
Queenstown Airport sees strong seasonal variation, with peak traffic in the summer months reflecting Southern Hemisphere travel patterns.
- January 2025 was the busiest month with 264,365 passengers.
- December 2024 and August 2024 followed with 248,806 and 235,405 respectively.
- May 2025 recorded the lowest traffic at 163,092, followed by June 2025 with 173,944.
How many routes are there at Queenstown Airport?
- Seven scheduled destinations comprise the core network.
- Three domestic routes connect to Auckland, Wellington, and Christchurch.
- Four international routes serve Sydney, Melbourne, Brisbane, and Gold Coast.
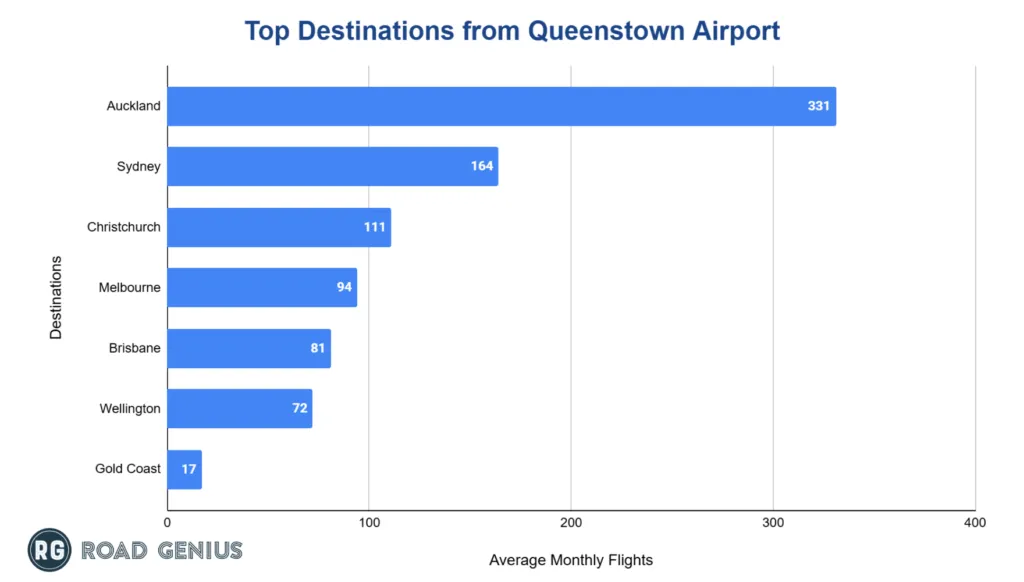
- Auckland-Queenstown represents the busiest route with over 330 monthly flights.
- All international services connect to Australian destinations on the east and south coasts.
Which destinations are the most popular from Queenstown Airport?
Queenstown Airport serves a focused network covering key cities in New Zealand and eastern Australia.
- Auckland (AKL) is the most popular domestic route, averaging 331 flights per month.
- Sydney (SYD) follows with 164 monthly flights.
- Christchurch (CHC) ranks third with 111 flights per month.
- Melbourne and Brisbane complete the top five with 94 and 81 flights respectively.
How much revenue has Queenstown Airport generated each year?
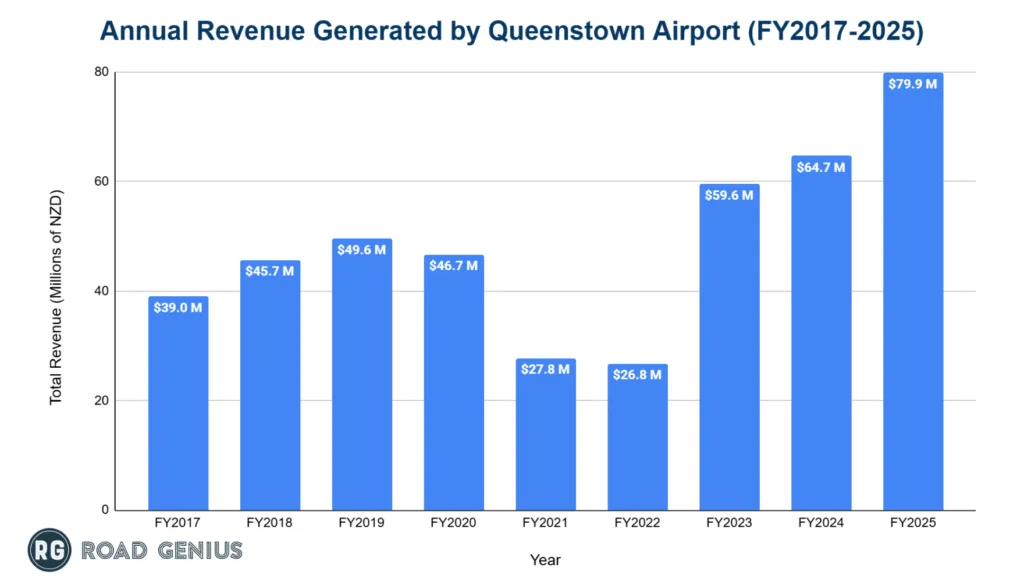
Queenstown Airport’s annual revenue reached over NZ$70 million in FY 2025, marking continued growth.
- FY2025 revenue totaled NZD 79.9 million, a 23.5% increase and the highest in airport history.
- FY2019 revenue was NZD 49.6 million and NZD 46.7 million in FY2020.
- Revenue fell to NZD 27.8 million in FY2021 and NZD 26.8 million in FY2022 during the pandemic.
- The airport rebounded in FY2023 with NZD 59.6 million, a 122.4% surge.
- FY2024 delivered NZD 64.7 million, growing 8.6% and surpassing pre-pandemic levels by over 30%.
More Statistics
What are the main causes of flight disruptions at Queenstown Airport?
- Strong crosswinds and wind shear are the primary causes of cancellations and diversions.
- The mountain valley terrain poses operational challenges and requires specialized pilot training.
- Mass cancellations occur during wind conditions exceeding safety thresholds.
- National system outages, such as air traffic control power failures, can also affect operations.
- Delays may result from late aircraft arrivals and ground handling issues.
What are the notable incidents at Queenstown Airport?
- December 2022: Two helicopters came into close proximity during departure. A Transport Accident Investigation Commission inquiry was launched, though no collision occurred.
- 2023: The terminal was evacuated for several hours after a suspicious object, later identified as an electric ski boot warmer, caused disruption to 25 flights.
References
- Queenstown Airport — financial reports and disclosures (operational data) · queenstownairport.co.nz
- Airlines and Popular Destinations from Queenstown Airport (FlightConnections) · flightconnections.com
- Simple Flying — reporting on incidents at Queenstown Airport · simpleflying.com

