

 Popular Countries
 24/7 Support
Updated
Wellington is the capital city of New Zealand, located on the southern tip of the North Island. It is known for its harbour, arts scene, and cultural heritage.
How many people visit Wellington every year?
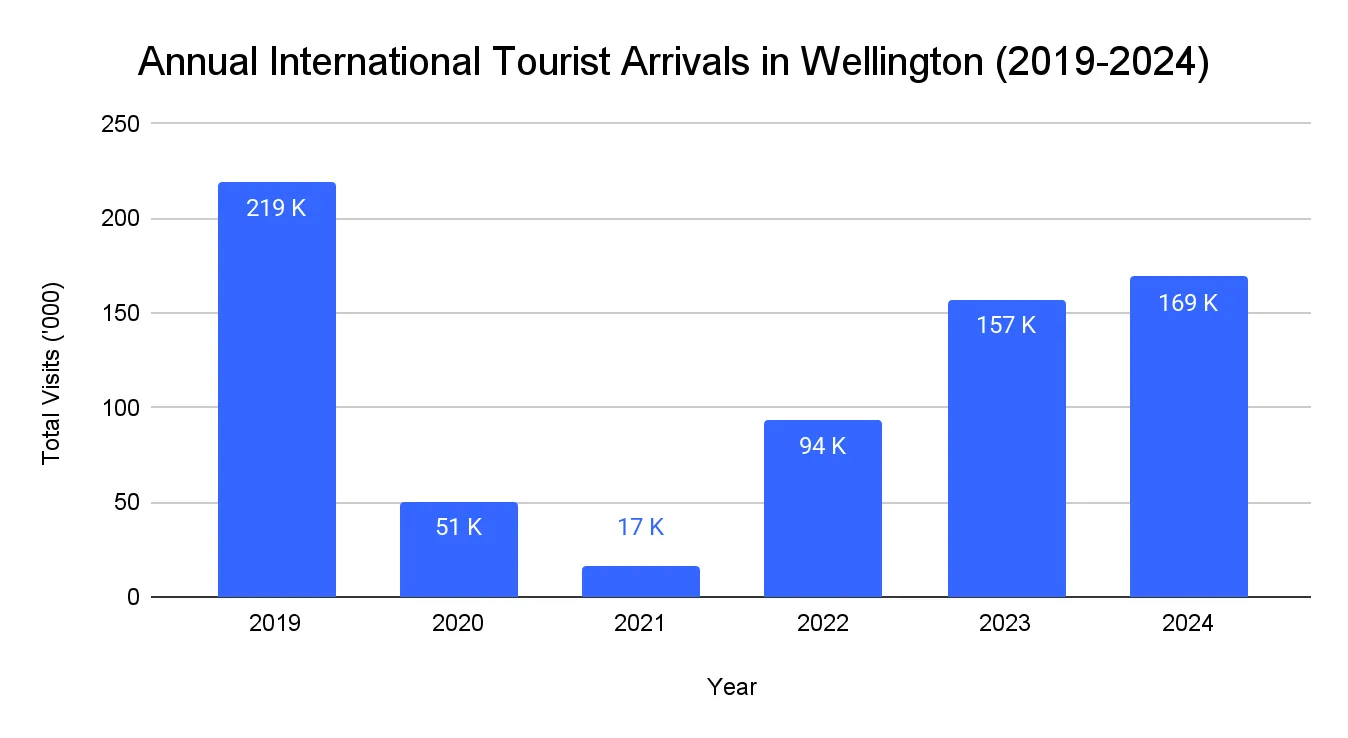
Over 169,073 international arrivals were reported by Wellington Airport in 20241.
- This represented a 22.7% decrease from the 218,839 international visitors in 2019 and a 7.6% increase from 2023's 157,128.
- This also reflected an increase of approximately 234.6% compared to the 50,527 arrivals in 2020.
- The growth from 2021, which saw 16,751 visitors, was even higher at around 909.3%.
- The arrivals continued to increase with 93,526 visitors in 2022, resulting in a 68% rise in 2023.
How many people visited Wellington in 2024?
- Wellington saw 169,073 international visitors in 2024, an increase of 7.6% from 157,128 arrivals in 2023.
- However, this figure remained 22.7% below the pre-pandemic peak of 218,839 arrivals recorded in 2019.
How much do visitors spend in Wellington every year?
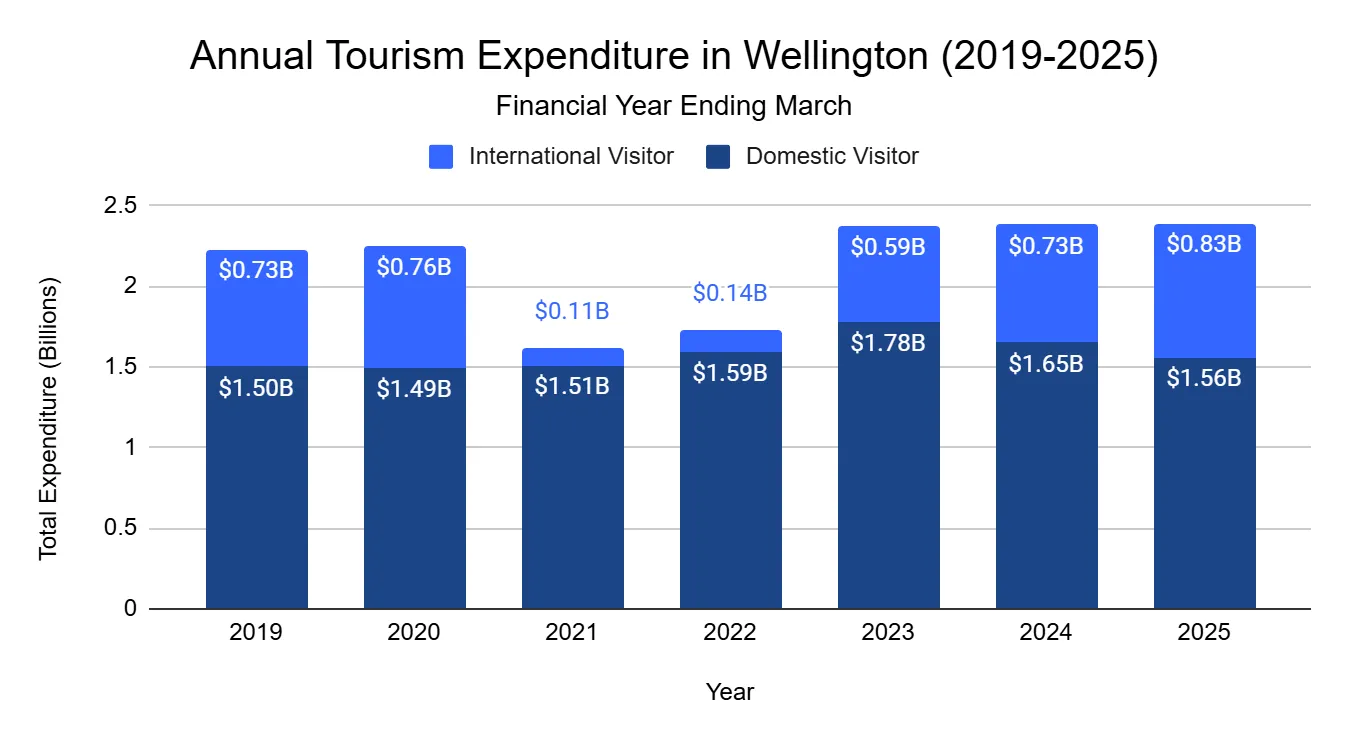
Tourist spending in Wellington City reached $2.39 billion in the year ending March 2025, with $825.5 million generated from international visitors and $1.56 billion from domestic visitors2.
- The tourism revenue remained almost constant with 2024’s figure ($2.38 billion) and only 20 million higher than 2023’s figure ($2.37 billion).
- Total tourism revenue in 2025 represented a 47.5% increase compared to the $1.62 billion in 2021 and a 38.2% increase from $1.73 billion in 2022.
- When compared to pre-pandemic year, It was 6.2% higher than the $2.25 billion recorded in the year ending March 2020.
How much do tourists spend in Wellington in 2025?
Visitors spent $2.39 billion in the fiscal year ending March 2025, 6.2% higher than the pre-pandemic level (FY 2020).
- International visitors spent $825.5 million, while domestic visitors spent $1.56 billion in that year.
How much do tourists spend in Wellington in 2024?
Tourist spending in Wellington reached $2.38 billion in the year ending March 2024.
- Domestic spending accounted for $1.65 billion of this total, marking a 7.3% decrease.
- Spending by international visitors rose by 25.2% to $733.9 million.
How much does it cost to visit Wellington?
- In 2024, international visitors to Wellington spent an average of NZ$4,910 per trip, which includes accommodation, food, transport, and activities, reflecting the city’s strong appeal to high-value travelers and its growing impact on New Zealand’s tourism economy.
Where do visitors to Wellington come from?
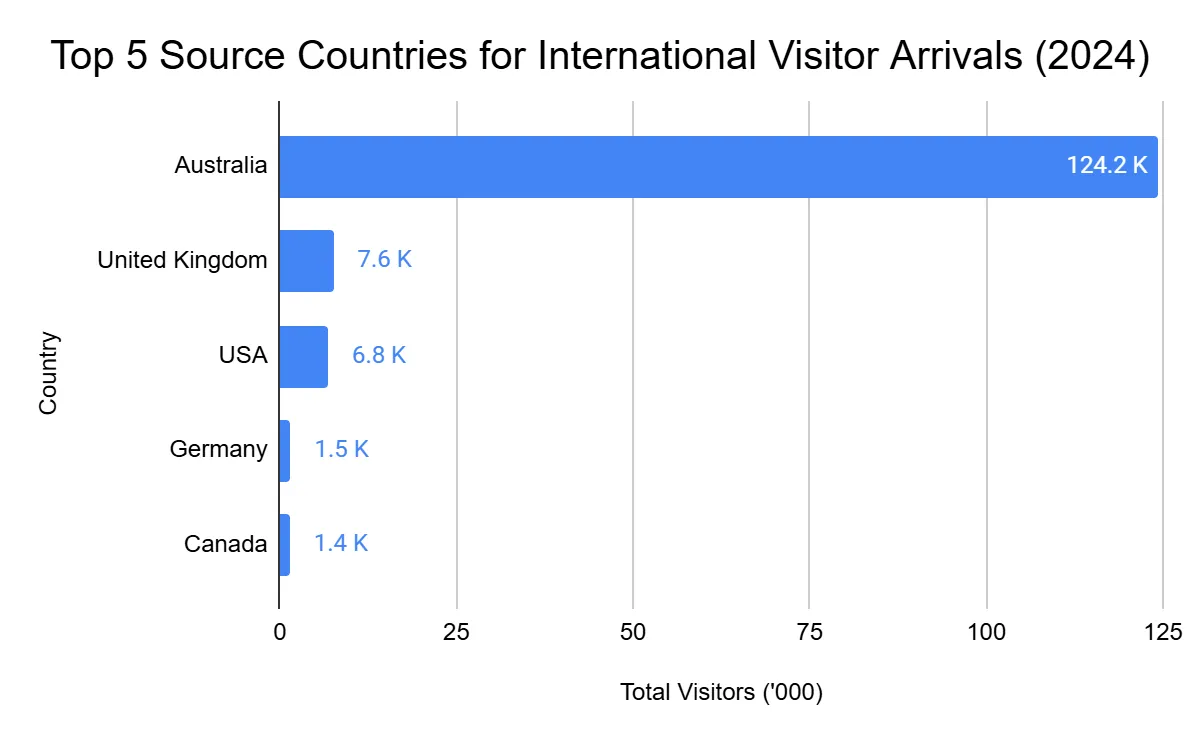
The majority of Wellington's international visitors come from Australia, with the UK, USA, Germany, Canada, China, Japan, and South Korea also contributing largely between 2017 and 20243.
- Australia was the top source of tourists, sending approximately 124,230 visitors.
- The UK was the next largest contributor, with 7,638 visitors
- The USA followed with 6,828 visitors, while Germany had 1,453 visitors.
- Canada completed the top 5 with 1,373 visitors.
How long do tourists stay in Wellington?
- Tourists visiting Wellington stay an average of 4.8 days per trip in 2024. This figure reflects the mean duration across all visitor types (domestic and international) using short-term accommodation, such as hotels, motels, and vacation rentals.
What were the peak tourist months in Wellington?
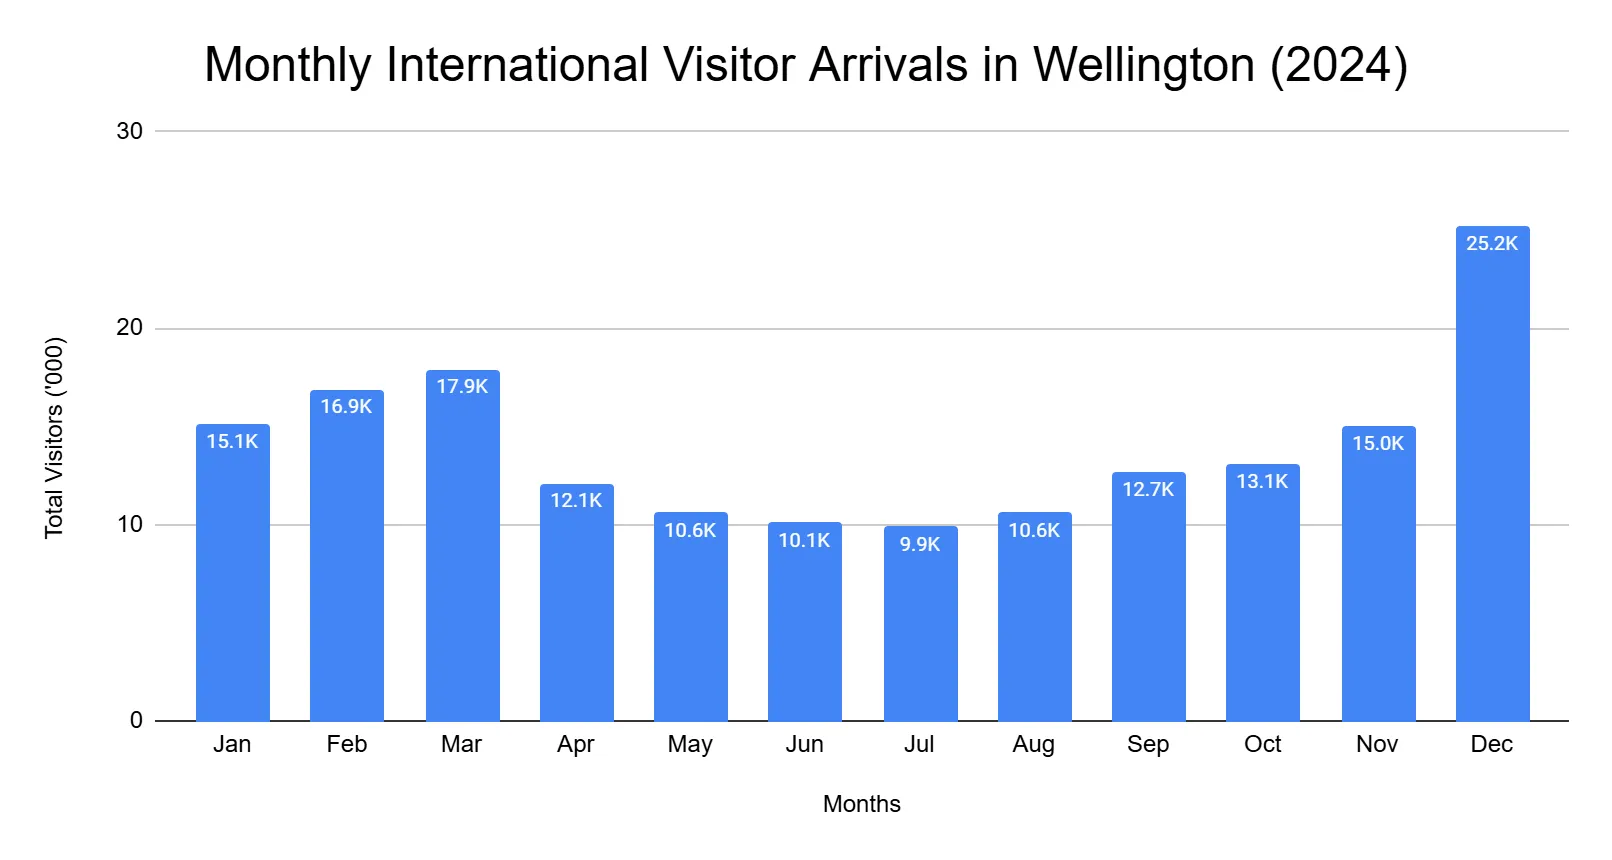
- In 2024, Wellington's peak visitor month was December, attracting 25,190 visitors.
- March and February followed with 17,879 and 16,865 visitors, respectively.
- January and November attracted 15,055 and 14,960 visitors, respectively.
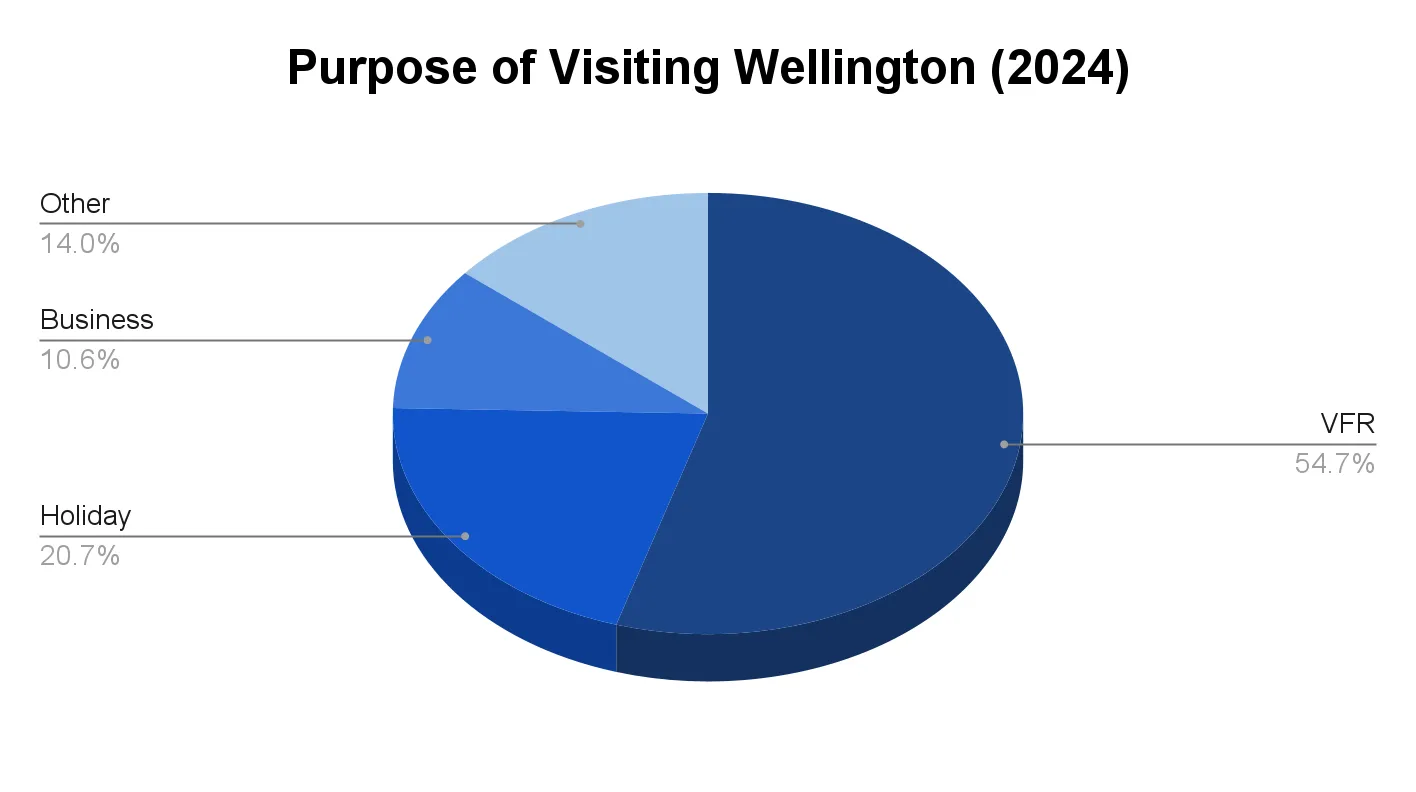
Why do people visit Wellington?
Visiting friends and relatives is the main reason for international tourists visiting Wellington each year.
- In 2024, Visiting friends and relatives made up the majority, with around 92,450 visitors, a 12.3% increase over the last year.
- Holiday visits was the second most popular reason, with approximately 35,029 visitors, up 11.2% from 2023.
- Business travel accounted for a smaller but significant amount, with 17,900 visitors.
How popular is Wellington as a tourist destination?
Wellington, New Zealand’s capital, continues to earn strong recognition for its culture, creativity, and livability. It consistently ranks as one of the most unique, high-quality, and sustainable urban destinations in New Zealand.
Key Awards & Accolades
- Zealandia Te Māra a Tāne, Wellington’s eco-sanctuary, won the Air New Zealand Supreme Tourism Award and the Airbnb Tourism Excellence Award (SME) at the 2023 New Zealand Tourism Awards — highlighting Wellington’s leadership in eco-tourism and conservation.
- The 2025 New Zealand Tourism Awards were hosted in Wellington, cementing the city’s importance as a national tourism hub.
- Wellington remains known globally as “the coolest little capital in the world,” celebrated for its arts, food, and creative industries.
- Ranked 20th in the world’s most liveable cities (2025), adding to its appeal for long-term visitors and international travelers.
- Regularly included in travel guides’ lists of “Top Cities to Visit in New Zealand” for its mix of natural beauty, harbour views, and vibrant cultural life.
Impact of Coronavirus - Wellington Tourism Statistics 2020 and 2021
The impact of the coronavirus pandemic deeply affected Wellington’s tourism, evident in the international arrival statistics and spending figures for 2020 and 2021.
- In 2020, Wellington Airport saw 50,527 international arrivals, a decrease of approximately 77% from 2019.
- In 2021, the number of international arrivals further decreased to 16,751, a 67% drop from 2020.
- In the year ending March 2021, tourism spending fell to $1.62 billion, a 28% drop from 2020.
- Domestic spending decreased slightly to $955.7 million, while international spending fell to $80.4 million in 2021 which was an 87.4% drop from $639 million in 2020.
- There was a slight recovery in total spending in the year ending March 2022, with spending reaching $1.73 billion (a 6.8% rise from 2021's $1.62 billion)..
- Domestic spending increased to $1.59 billion, while international spending rose to $140 million.
More Statistics
- Auckland Tourism Statistics
- New Zealand Tourism Statistics
- Queenstown Tourism Statistics
- Christchurch International Airport Statistics
- Queenstown Airport Statistics
- Wellington Airport Statistics
Wellington Tourism Statistics 2019
- In the year ending December 2019, Wellington Airport welcomed over 218,839 international arrivals.
- In the fiscal year ending March 2019, Wellington's total tourism expenditure was $1.59 billion, with $973.2 million from domestic visitors and $614.6 million from international visitors.
- By the end of March 2020, the total expenditure increased by 0.6% to $1.6 billion, with domestic expenditure slightly decreasing to $964.2 million, while international expenditure grew by 4% to $639 million.
Top Attractions in Wellington
- Te Papa Tongarewa: New Zealand's national museum, focused on cultural and natural heritage, attracting around 1.5 million visitors annually.
- Wellington Cable Car: Running from Lambton Quay to the Botanic Garden, this cable car serves as both a transport option and a scenic attraction, drawing close to 1 million passengers per year.
- Zealandia: An urban eco-sanctuary dedicated to conservation and native wildlife, receiving over 100,000 visitors annually.
- Mount Victoria: A popular viewpoint offering panoramic views of Wellington, attracting more than 4 million visitors each year.
- Wellington Botanic Garden: A historic garden visited by 400,000 people annually, known for its landscaped grounds, Begonia House, and seasonal displays.
References
- Figure.NZ: Tourism Visitor Summary · figure.nz ↑
- Infometrics Regional Economic Profile: Wellington Region — Tourism Expenditure · regions.infometrics.co.nz ↑
- Queenstown Insights and Statistics (Figure.NZ) · figure.nz ↑

