

 Popular Countries
 24/7 Support
Published
Wellington Airport (WLG) is the main gateway to New Zealand’s capital city and ranks as the country’s third busiest airport. It handles over 5 million passengers each year and operates on one of the world’s smallest airport footprints, covering just 110 hectares.
How many passengers pass through Wellington Airport each year?
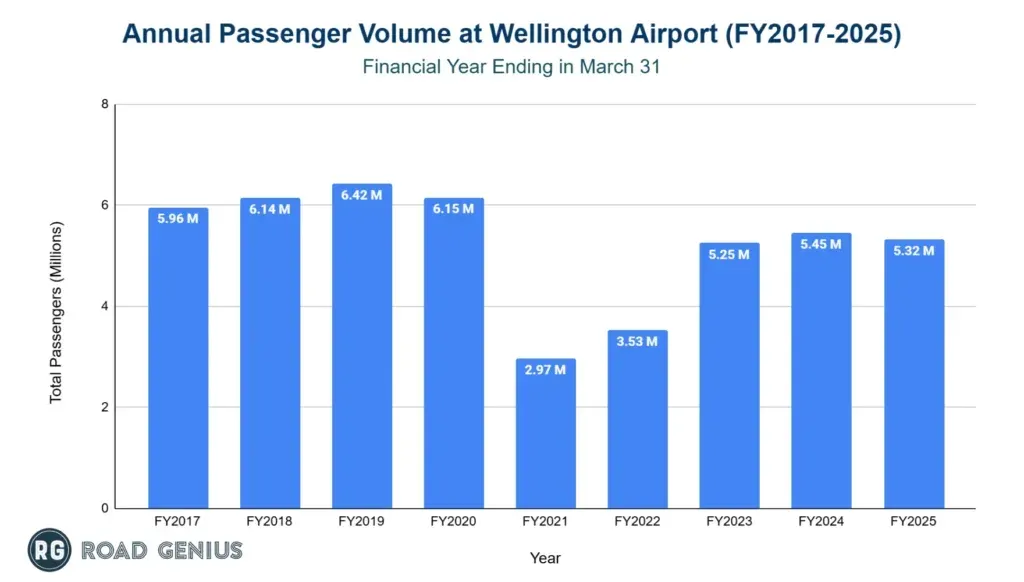
Wellington Airport handles more than 5 million passengers annually. Despite challenges in the domestic market, international traffic continues to show strong growth.
- WLG processed 5.32 million passengers in the year ending March 2025 (FY2025), representing a 2.4% decrease from the 5.45 million recorded in FY2024.
- The airport hit its pre-pandemic peak with 6.2 million passengers in FY2020, before the COVID-19 crisis significantly disrupted operations. Passenger traffic dropped to 2.97 million in FY2021, a 51.7% decline, marking the lowest point in recent years.
- Recovery began in FY2022 with 3.53 million passengers, increased to 5.25 million in FY2023, and reached 5.45 million in FY2024.
Domestic vs International Travellers
Wellington Airport maintains a strong domestic focus, with 85% of total traffic on domestic routes. However, international travel continues to grow at a faster pace.
- Domestic routes carried 4.53 million passengers in FY2025, accounting for 85.1% of total traffic, which is a 3.9% decline from the previous year.
- International routes served approximately 791,000 passengers, or 14.9% of the total, reflecting a 7.4% year-on-year increase.
- In FY2025, domestic travel reached 86.7% of pre-COVID levels, while international travel recovered to 86.1% of FY2020 volumes.
| Passenger Movements: Domestic vs International | ||
|---|---|---|
| Year | Domestic | International |
| FY2020 | 5,226,939 | 919,132 |
| FY2021 | 2,968,692 | 162 |
| FY2022 | 3,482,333 | 48,667 |
| FY2023 | 4,689,792 | 564,255 |
| FY2024 | 4,711,211 | 736,568 |
| FY2025 | 4,525,694 | 790,866 |
What is the total number of aircraft operations at Wellington Airport each year?
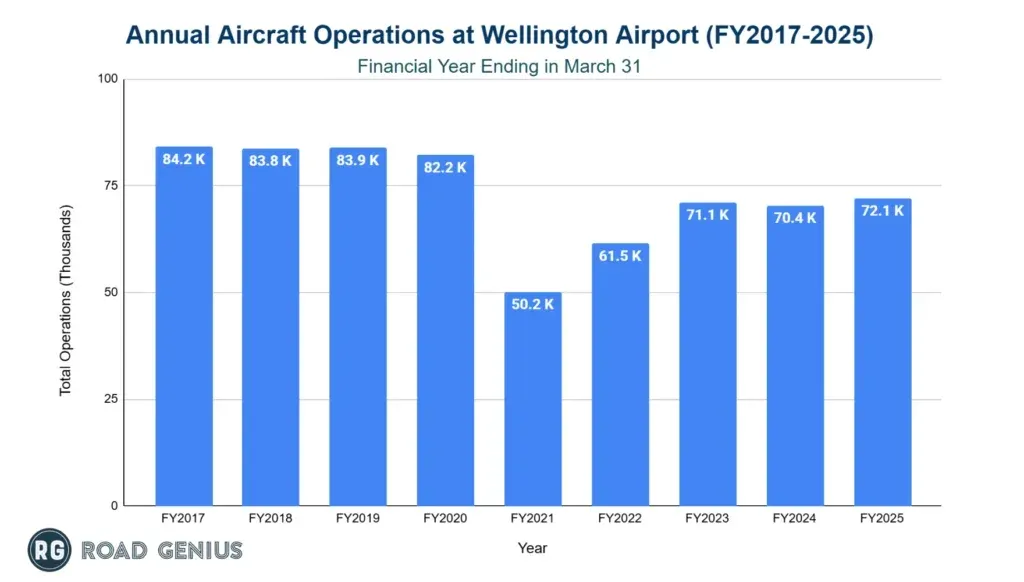
Wellington Airport records more than 70,000 aircraft movements annually. While activity has rebounded since the pandemic, volumes remain below pre-COVID levels.
- The airport recorded 72,086 aircraft movements in FY2025, a 2.4% increase from 70,410 in FY2024.
- Aircraft operations peaked at 82,217 in FY2020 before falling to 50,226 in FY2021, a 38.9% decline.
- Recovery continued with 61,475 movements in FY2022 and 71,102 in FY2023.
Domestic vs International Operations
Wellington Airport’s flight operations are heavily domestic, with international flights making up a smaller but expanding share.
- Domestic flights totaled 66,589 in FY2025, or 92.4% of total operations.
- International flights made up 5,497 movements, accounting for 7.6%.
| Aircraft Movements: Domestic vs International | ||
|---|---|---|
| Year | Domestic | International |
| FY2020 | 75,578 | 6,639 |
| FY2021 | 50,215 | 5 |
| FY2022 | 60,885 | 590 |
| FY2023 | 67,258 | 3,844 |
| FY2024 | 65,166 | 5,244 |
| FY2025 | 66,589 | 5,497 |
Which airlines operate the most flights out of Wellington Airport?
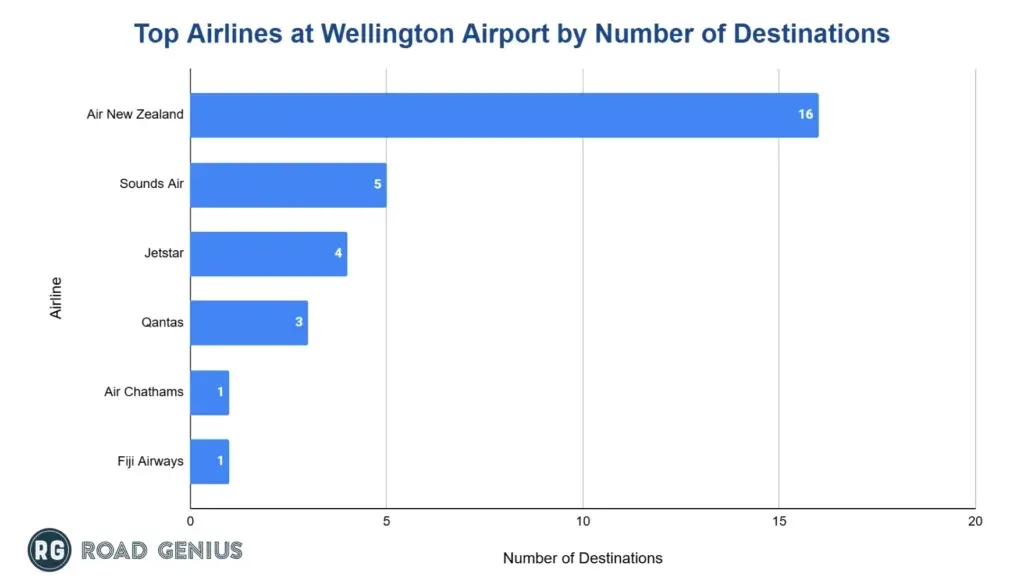
Air New Zealand is the dominant carrier at Wellington Airport, primarily serving domestic destinations. Qantas leads among international carriers, following a strong post-pandemic recovery.
- Air New Zealand serves 16 destinations.
- Sounds Air connects to 5 destinations.
- Jetstar operates 4 routes.
- Qantas serves 3 destinations.
What are the monthly trends in passenger traffic at Wellington Airport?
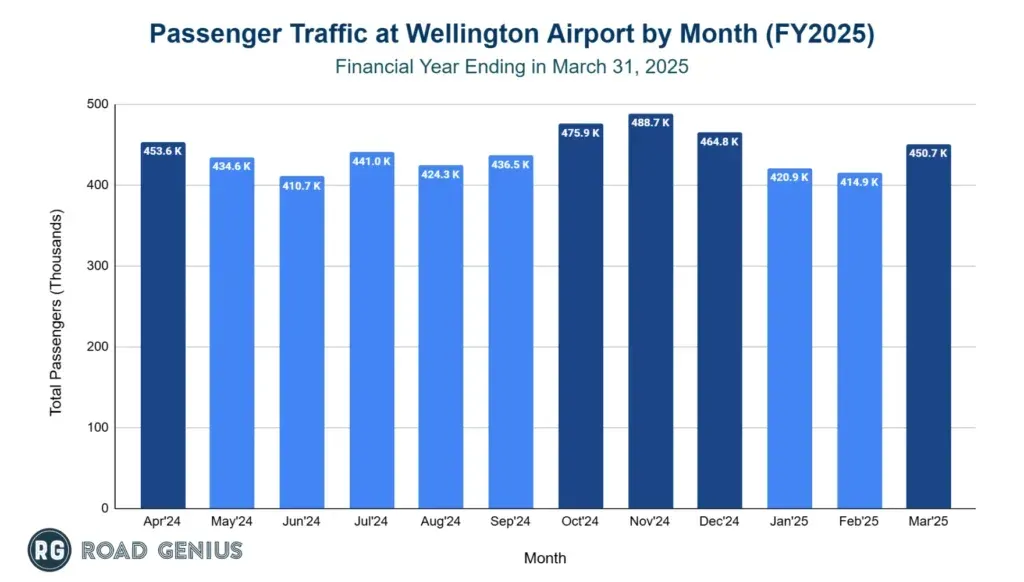
Passenger numbers typically peak from October to December, with each month exceeding 450,000 travelers in FY2025.
- November 2024 was the busiest month with 488,661 passengers.
- October 2024 followed with 475,904.
- December 2024 recorded 464,808.
- The lowest months were June 2024 and February 2025 with 410,650 and 414,873 passengers respectively.
How many routes are there at Wellington Airport?
- The airport has successfully restored all pre-pandemic international routes as of FY2025
- Most international carriers are now operating at or above their previous capacity levels
- Domestic network includes major trunk routes to Auckland, Christchurch, and Queenstown
- Regional domestic connections serve smaller centers including Nelson, Blenheim, and other regional airports (the Invercargill service has been discontinued).
- International destinations include Australia (Sydney, Melbourne, Brisbane), Pacific Islands (Fiji, New Caledonia), and other select routes
Which destinations are the most popular from Wellington Airport?
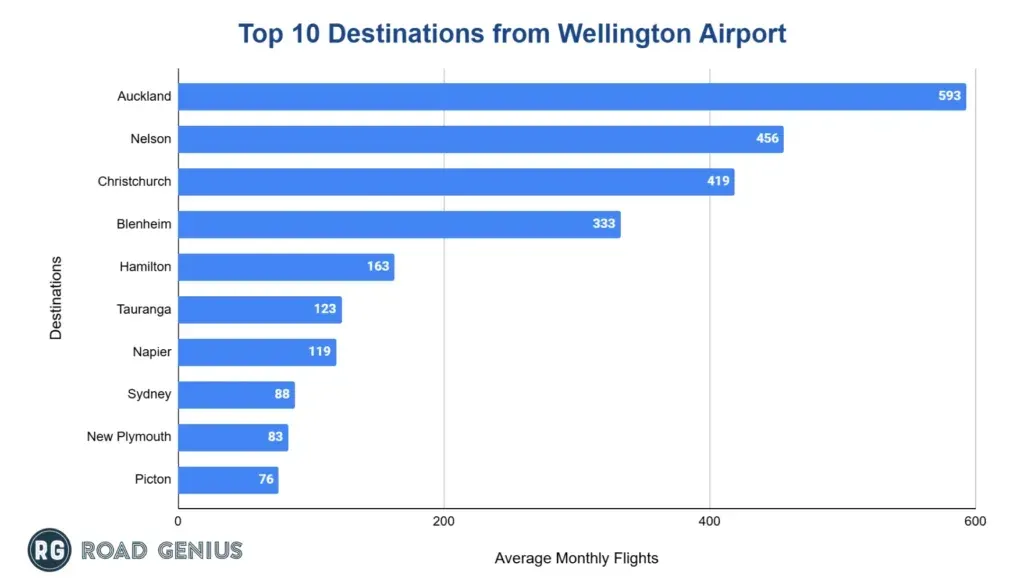
Wellington’s busiest connections are to major New Zealand cities and Australia.
- Auckland (AKL) leads with 593 flights per month.
- Nelson (NSN) follows with 456 monthly flights.
- Christchurch (CHC) ranks third with 419 flights.
- Blenheim (BHE) and Hamilton (HLZ) round out the top five with 333 and 163 average monthly flights respectively.
How much EBITDAF has Wellington Airport generated each year?
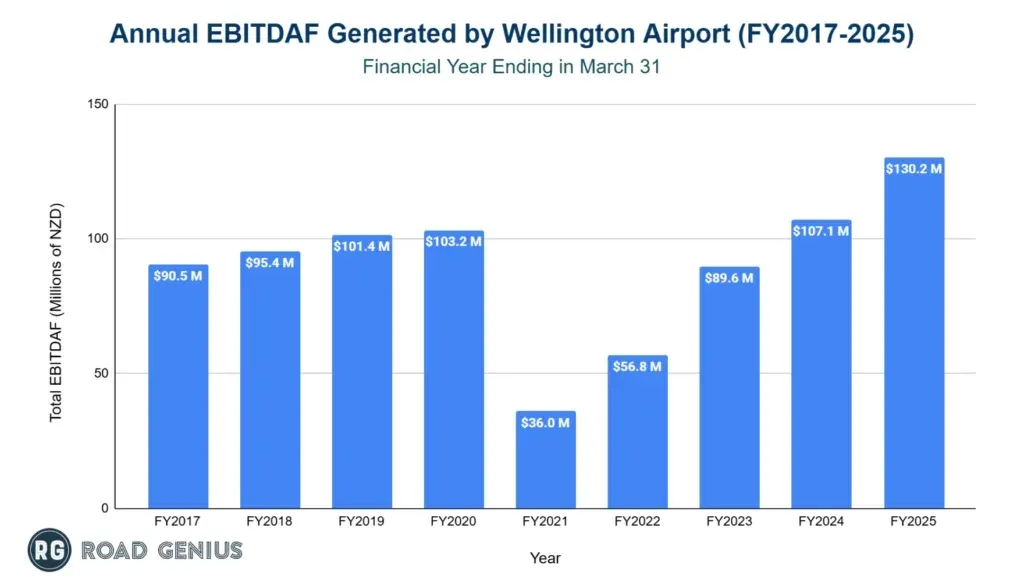
Wellington Airport consistently generates more than NZD 100 million in EBITDAF annually.
- In FY2025, EBITDAF reached a record NZD 130.2 million, up 21.6% from NZD 107.1 million in FY2024.
- Pre-pandemic EBITDAF was NZD 101.4 million in FY2019 and grew slightly to NZD 103.2 million in FY2020.
- During the pandemic’s worst year (FY2021), EBITDAF dropped to NZD 36.0 million.
- The recovery saw increases to NZD 56.8 million in FY2022 and NZD 89.6 million in FY2023.
What are the main causes of flight disruptions at Wellington Airport?
- Weather, particularly high winds that exceed 150 km/h, is the leading cause.
- Technical or operational issues including engine availability problems affecting Air New Zealand’s fleet.
- Air traffic congestion during peak hours.
- Late-arriving aircraft and crew scheduling challenges.
- Fog and low visibility occasionally affect operations.
More Statistics
- Auckland Airport Statistics
- Christchurch International Airport Statistics
- Queenstown Airport Statistics
- Auckland Tourism Statistics
- New Zealand Tourism Statistics
- Electric Car Rental Statistics: New Zealand
What are the notable incidents at Wellington Airport?
- 1 September 2024: An Air New Zealand ATR72 (ZK-MVL) suffered an engine failure on final approach. The crew declared a mayday and performed a safe emergency landing. All passengers were evacuated safely.
- 20 February 2014: Thick fog caused widespread flight disruptions throughout the day.
Other relevant facts about Wellington Airport
- Wellington Airport comprises a small 110-hectare (270-acre) site on the Rongotai isthmus.
- The airport has a single 2,081-metre (6,827 ft) runway.
- Wellington Airport operates a single terminal at the east of the airport, with three piers.
- It was named “2024 Airport of the Year” in the large airport category at NZ Airport Awards.
- The airport is owned by Infratil (66%) and Wellington City Council (34%).
- Wellington Airport has achieved Level 4+ ‘Transition’ under the globally recognized Airport Carbon Accreditation program.
References
- Wellington Airport — operational data and financial reports · wellingtonairport.co.nz
- FlightConnections — airlines and destinations from Wellington (WLG) · flightconnections.com
- Simple Flying — reporting on incidents at Queenstown Airport · simpleflying.com

