

 Popular Countries
 24/7 Support
Published 9 Sept 2026
Canada recorded 91,750 casualty collisions in 2023, meaning collisions that involved at least one death or injury and excluded property-damage-only crashes. Transport Canada also reported 1,964 motor vehicle fatalities in 2023, the highest annual fatality count in the past 10 years.
How many car accidents happen in Canada each year?
Canada recorded 91,750 casualty collisions, 1,964 fatalities, and 118,838 total injuries in motor vehicle collisions in 2023.
- Casualty collisions fell from 116,292 in 2014 to 104,640 in 2019, then dropped to 79,990 in 2020 during the pandemic period.
- The 2023 casualty-collision count was 2.4% lower than 2022 and 12.3% lower than 2019.
- Canada averaged about 251 casualty collisions per day in 2023, based on 91,750 casualty collisions divided by 365 days.
- Fatalities rose from 1,931 in 2022 to 1,964 in 2023, while total injuries fell from 123,317 to 118,838.
| Year | Casualty Collisions | Fatalities | Total Injuries |
|---|---|---|---|
| 2014 | 116,292 | 1,841 | 156,557 |
| 2019 | 104,640 | 1,756 | 139,084 |
| 2020 | 79,990 | 1,746 | 104,286 |
| 2022 | 93,976 | 1,931 | 123,317 |
| 2023 | 91,750 | 1,964 | 118,838 |
Source · Note: Casualty collisions include fatal and injury collisions. Property-damage-only collisions are excluded.
What are the leading causes of car accidents in Canada?
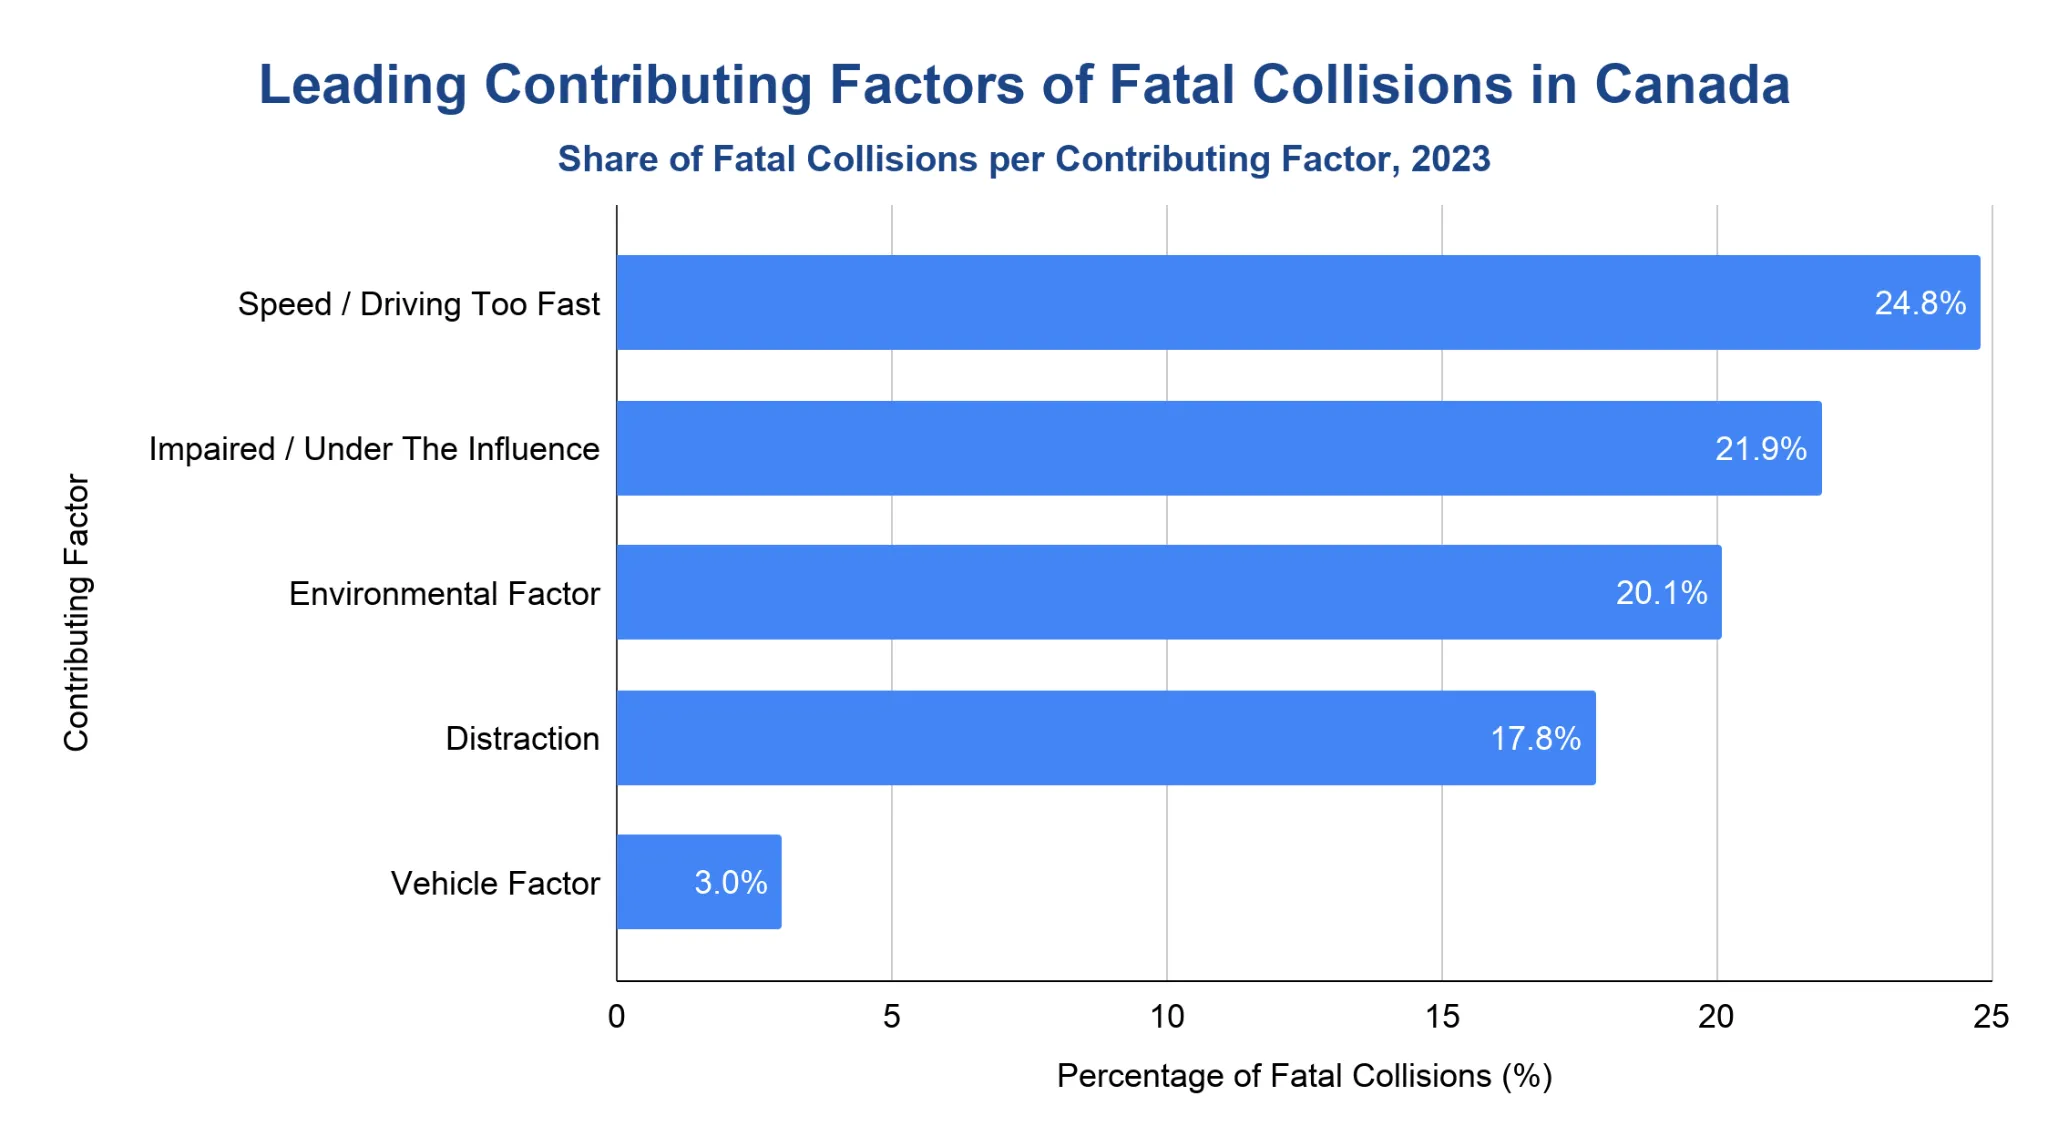
The leading reported contributing factors in Canadian fatal collisions were speed or driving too fast, impaired or under-the-influence driving, environmental factors, and distraction in 2023.
- Speed or driving too fast was reported in 24.8% of fatal collisions.
- Impaired or under-the-influence driving was reported in 21.9% of fatal collisions.
- Environmental factors were reported in 20.1% of fatal collisions.
- Distraction was reported in 17.8% of fatal collisions, down from 22.5% in 2021.
Note: Contributing factors can overlap because more than one factor can be reported for the same fatal collision. These percentages should not be added together as a total.
When do most car accidents happen in Canada?
Transport Canada’s motor vehicle casualties dashboard showed that late afternoon, Friday, and August had the highest casualty counts in their respective time categories.
- The 3 p.m. to 5:59 p.m. period had the highest cumulative injury count between 2014 and 2023, with 348,869 injuries.
- Friday had the highest day-of-week injury count over the 10-year period, with 227,011 injuries.
- August had the highest total monthly injury count from 2014 to 2023, with 126,685 injuries.
| Time Pattern | Highest Period | Fatalities | Injuries |
|---|---|---|---|
| Time Of Day | 3:00 p.m. to 5:59 p.m. | 3,495 | 348,869 |
| Day Of Week | Friday | 3,048 | 227,011 |
| Month | August | 2,059 | 126,685 |
Source · Note: Dashboard time-pattern data counts motor vehicle casualties from 2014–2023, not total collisions or 2023-only collisions.
Which provinces have the highest car accident fatality rates?
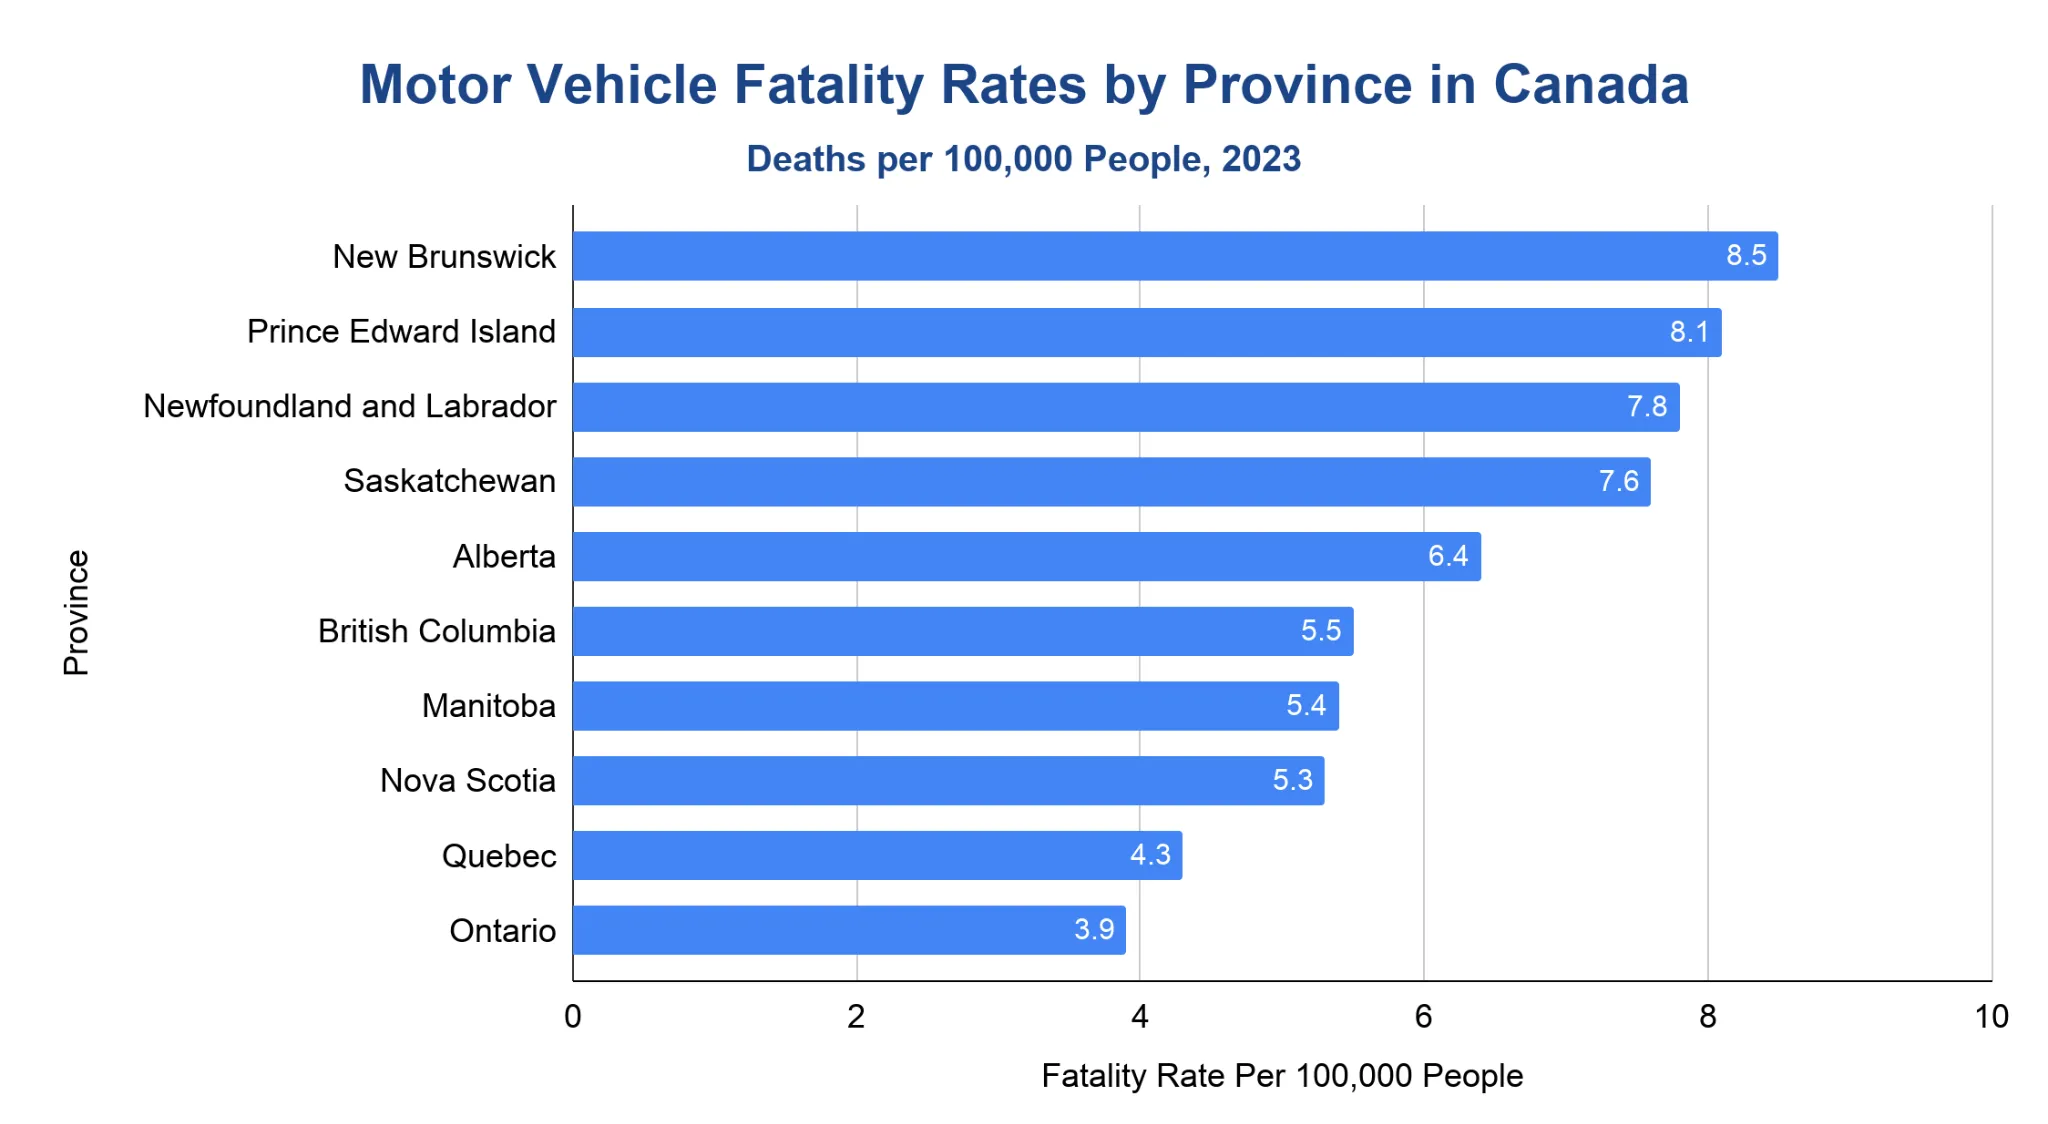
Among provinces, New Brunswick had the highest 2023 motor vehicle fatality rate, at 8.5 deaths per 100,000 people.
- Prince Edward Island ranked second, with 8.1 deaths per 100,000 people.
- Newfoundland and Labrador recorded 7.8 deaths per 100,000 people.
- Saskatchewan recorded 7.6 deaths per 100,000 people.
- Ontario had one of the lowest provincial rates, at 3.9 deaths per 100,000 people.
Note: Rate-based data in smaller jurisdictions can fluctuate because of smaller sample sizes. Territory rates are not included in the provincial ranking table.
What types of roads see the most car accidents in Canada?
Urban areas accounted for most personal injury collisions in 2023, while rural areas accounted for most fatal collisions.
- Urban areas recorded 65,834 personal injury collisions.
- Rural areas recorded 22,051 personal injury collisions.
- Rural areas also recorded 932 fatal collisions, compared with 799 in urban areas.
- Another 37 fatal collisions and 2,097 personal injury collisions had no stated urban or rural location.
| Location | Fatal Collisions, 2023 | Personal Injury Collisions, 2023 |
|---|---|---|
| Urban | 799 | 65,834 |
| Rural | 932 | 22,051 |
| Not Stated | 37 | 2,097 |
| Total | 1,768 | 89,982 |
Source · Note: Transport Canada defines urban and rural areas by road type, speed limit, or jurisdiction-specific reporting rules. In some provinces, urban and rural boundaries follow municipal boundaries.
Most Affected Age Groups by Car Accidents in Canada
People aged 65 and older had the highest fatality count in 2023, while people aged 25–34 had the highest total injury count.
- People aged 65 and older accounted for 446 fatalities and 14,863 total injuries.
- People aged 25–34 accounted for 336 fatalities and 22,572 total injuries.
- Road users aged 15–19 accounted for 136 fatalities, 768 serious injuries, and 9,855 total injuries.
- The 65 and older group accounted for 20.7% of driver fatalities and 24.5% of passenger fatalities.
| Age Group | Fatalities, 2023 | Total Injuries, 2023 |
|---|---|---|
| 15–19 | 136 | 9,855 |
| 20–24 | 164 | 12,333 |
| 25–34 | 336 | 22,572 |
| 35–44 | 285 | 18,881 |
| 45–54 | 246 | 16,121 |
| 55–64 | 292 | 14,305 |
| 65 And Older | 446 | 14,863 |
Source · Note: These figures are for road users by age group, not drivers involved in collisions.
What vehicle types are most frequently involved in car accidents in Canada?
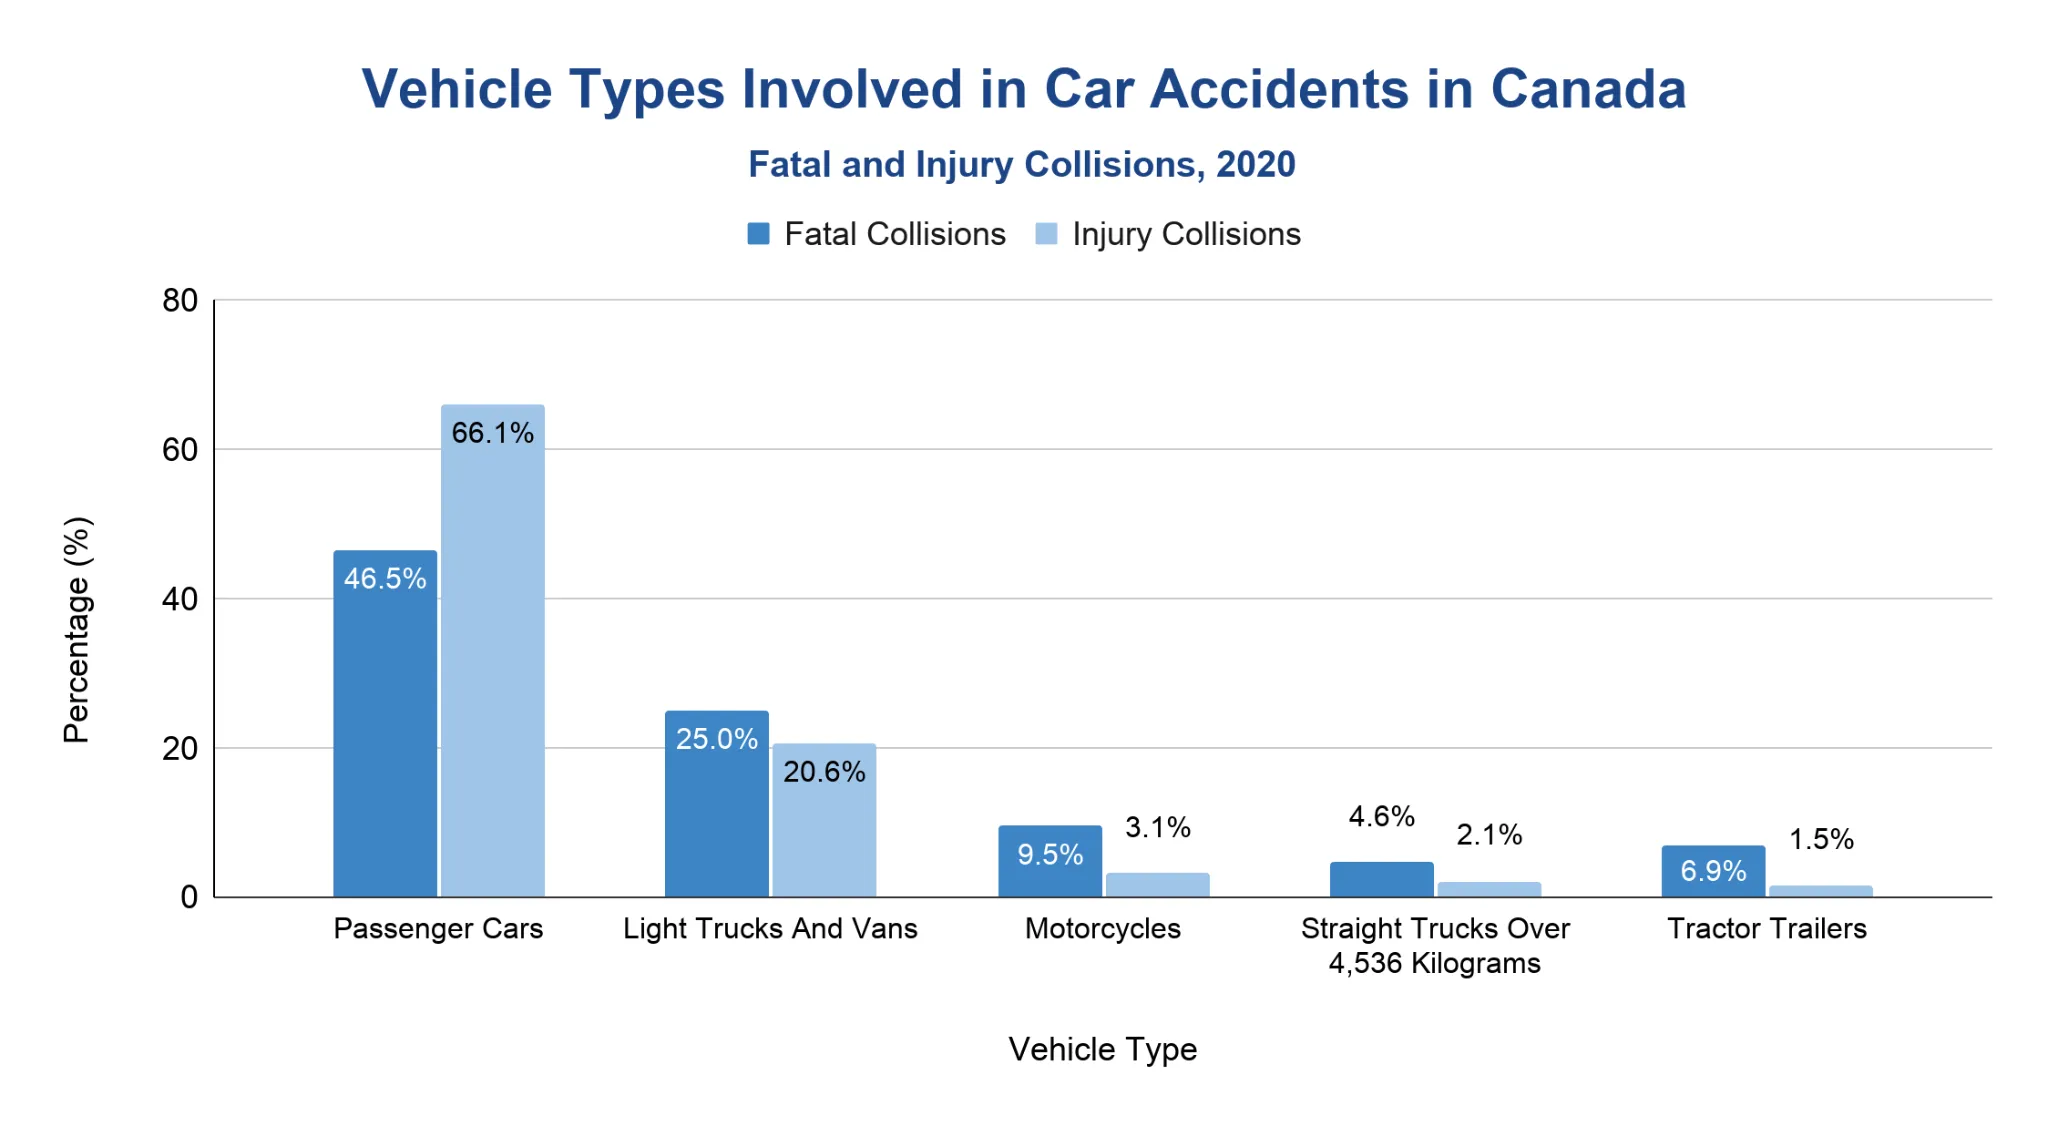
Passenger cars were the most common vehicle type involved in Canadian motor vehicle collisions in 2020, followed by light trucks and vans.
- Passenger cars made up 46.5% of vehicles involved in fatal collisions and 66.1% of vehicles involved in injury collisions.
- Light trucks and vans made up 25% of vehicles involved in fatal collisions and 20.6% of vehicles involved in injury collisions.
- Motorcycles made up 9.5% of vehicles involved in fatal collisions.
- Seatbelt use was high in Canada, with 97.2% of front-seat occupants of light-duty vehicles observed wearing seatbelts in 2016–2017.
- Seatbelts can reduce the risk of death in a collision by 47% when worn correctly.
Note: Vehicle-type shares show vehicles involved by collision severity. They do not measure crash risk per registered vehicle or per kilometre driven.
How much do car accidents cost Canada’s economy each year?
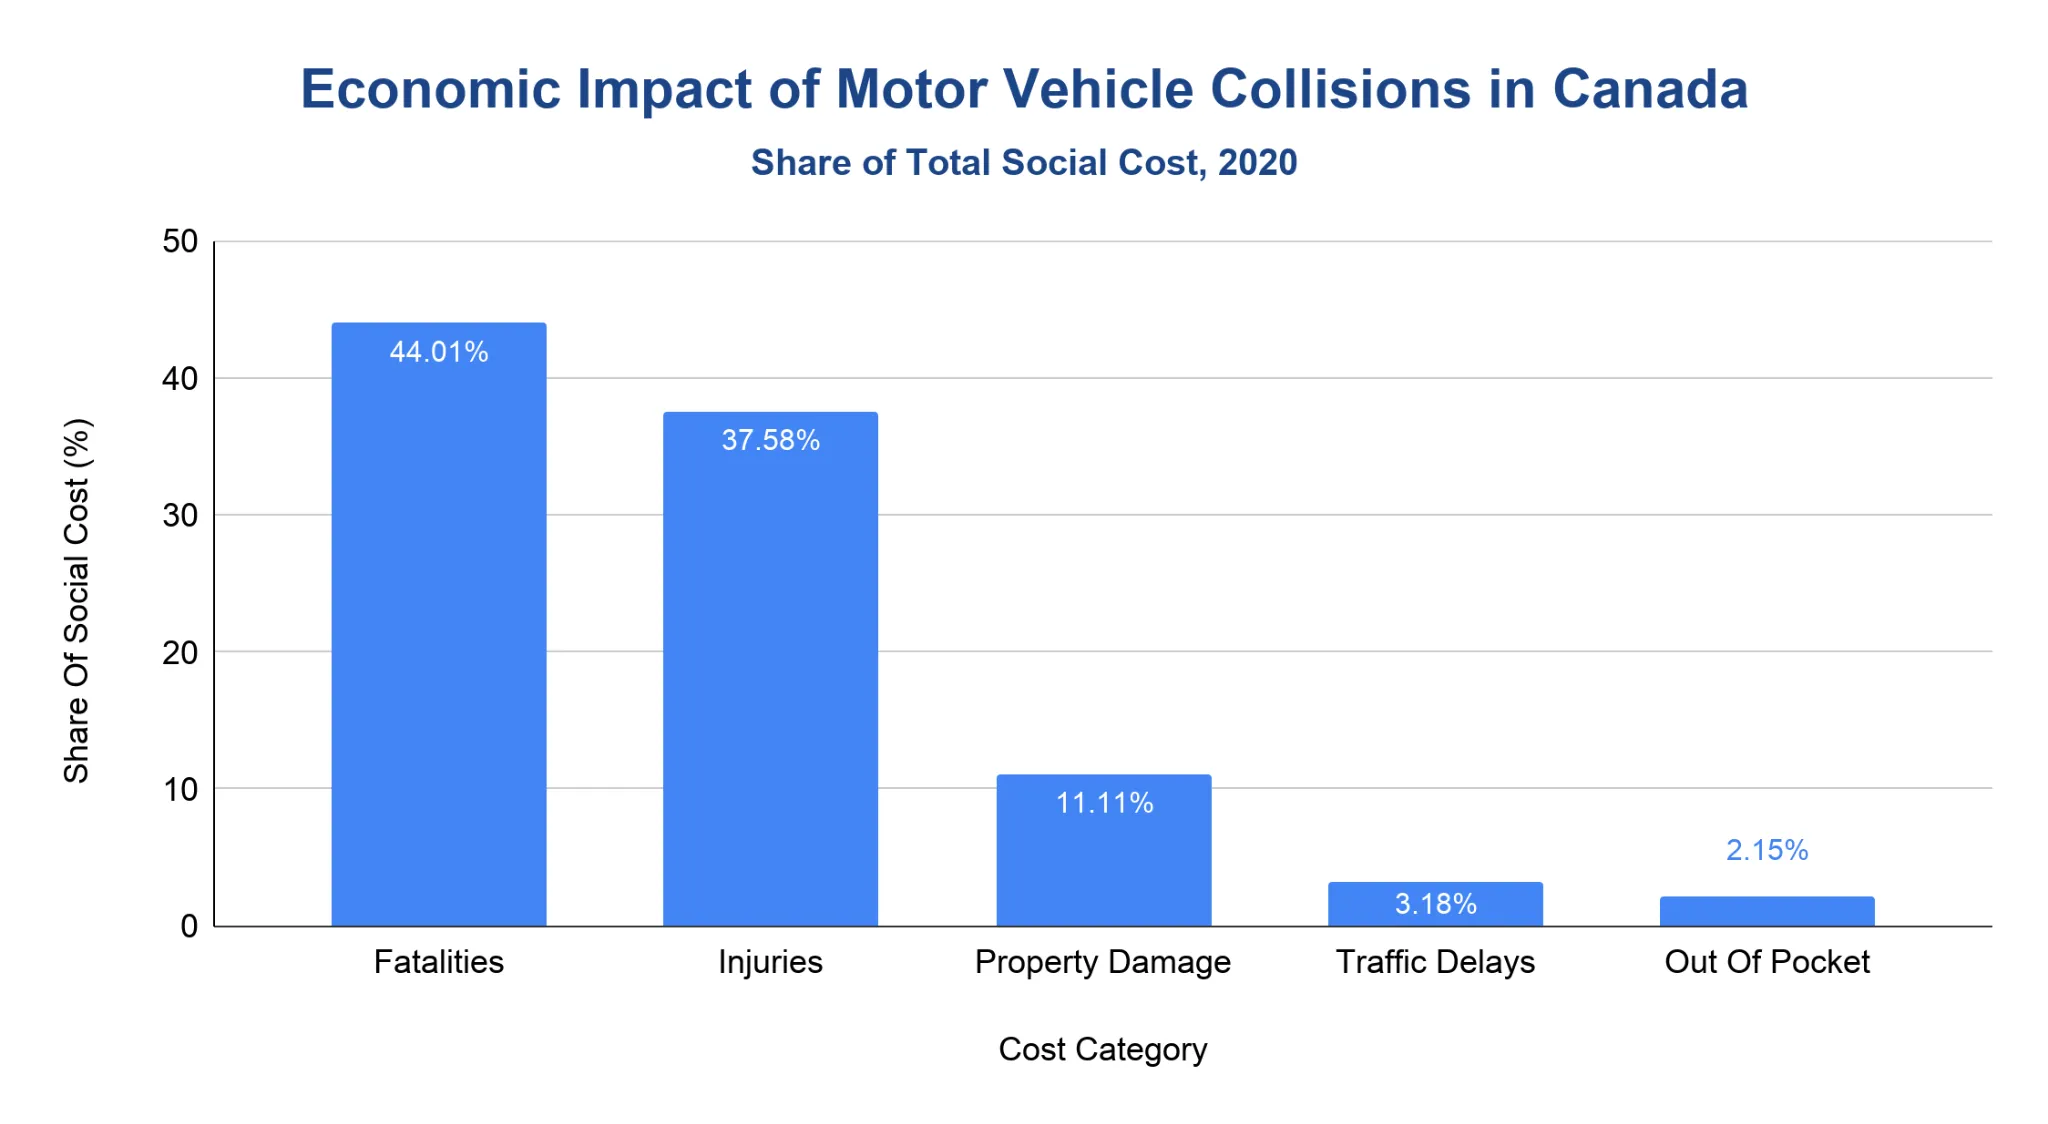
Transport Canada estimated the social cost of motor vehicle collisions in Canada at 35.98 billion Canadian dollars (CAD) in 2020.
- The social cost of collisions equalled 1.92% of gross domestic product in 2020.
- The cost was CAD 1,334 per licensed driver and CAD 946.65 per person.
- Fatalities accounted for 44.01% of total collision social costs.
- Injuries accounted for 37.58%, while property damage accounted for 11.11%.
Note: Social cost is broader than direct insurance or repair cost. Transport Canada’s model includes fatalities, injuries, property damage, delays, healthcare, emergency services, policing, courts, towing, and out-of-pocket costs.
More Statistics
- Calgary Airport Statistics
- Edmonton International Airport Statistics
- Halifax Airport Statistics
- Kelowna International Airport Statistics
- Regina Airport Statistics
- Toronto Pearson Airport Statistics
Overall Accident Rate in Canada
Canada’s long-term motor vehicle collision indicators improved substantially, but recent fatality counts showed a post-pandemic rebound.
- Casualty collisions decreased from 116,292 in 2014 to 91,750 in 2023, a 21.1% decline.
- Total injuries decreased from 156,557 in 2014 to 118,838 in 2023, a 24.1% decline.
- Fatalities increased from 1,841 in 2014 to 1,964 in 2023, a 6.7% increase.
- The 2023 fatality rate was 4.9 deaths per 100,000 people and 4.5 deaths per billion vehicle-kilometres travelled.
| Metric | 2014 | 2023 | Change (%) |
|---|---|---|---|
| Casualty Collisions | 116,292 | 91,750 | -21.1 |
| Fatalities | 1,841 | 1,964 | 6.7 |
| Total Injuries | 156,557 | 118,838 | -24.1 |
Source · Note: Collision and injury counts improved over the decade, while the latest fatality count was elevated relative to the 2014–2023 period.

