Page last update: 25 March 2026
The cost of fuel in the U.S. is influenced by global oil prices, state taxes, and supply chain factors, impacting consumers and businesses nationwide.
Fuel Price Trends
What is the price of fuel in the U.S. in 2024?
The national average price of regular gasoline in the U.S. in 2024 is $3.42 per gallon ($0.90 per liter), while diesel fuel averages $3.76 per gallon ($0.99 per liter).

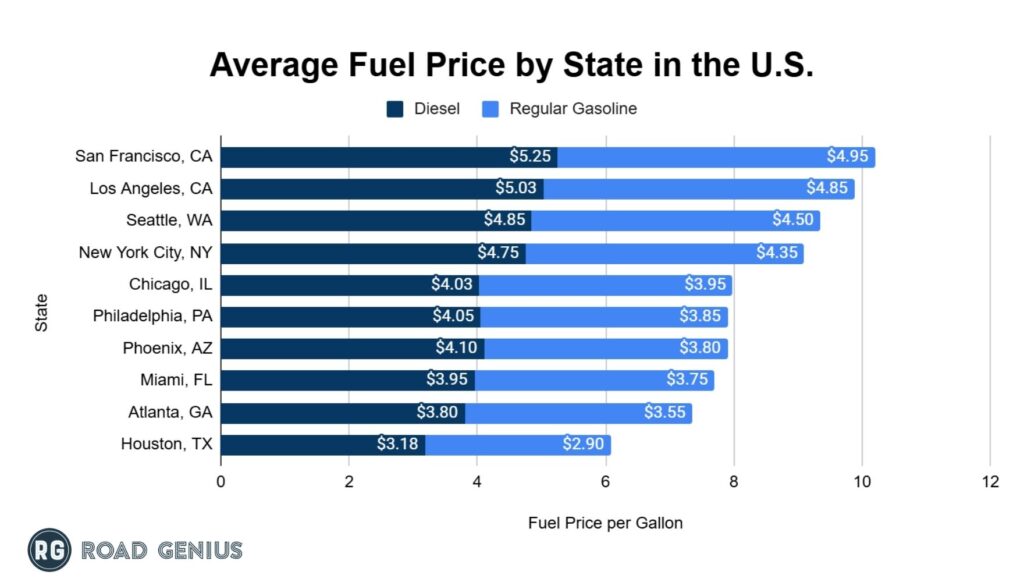
How much does diesel cost in major cities?
Californian cities, specifically Los Angeles, have the highest fuel prices, totaling $5.03 per gallon for diesel, while regular gasoline costs an average of $4.85 per gallon, due to stricter environmental regulations and taxes.
- Miami, Florida, and Atlanta, Georgia, feature lower prices due to reduced state fuel taxes and closer proximity to oil refineries.
How do the U.S. fuel prices compare to global averages?
U.S. gasoline prices are approximately 31.6% lower than the global average and between 47% and 57% lower than European fuel prices in 2024, due to lower fuel taxes and high domestic production.
- Canadian fuel prices are approximately 52% higher than the U.S. average, largely due to higher taxation and refining costs.
- European fuel prices reflect higher taxation and carbon pricing policies, significantly increasing costs at the pump.
Gasoline Price Comparison (2024)
| Location | Gasoline Price (USD per Gallon) |
| United States | $3.42 |
| Global Average | $5.00 |
| European Union | $6.50 – $8.00 |
| Canada | $5.20 |
Fuel Spending Statistics: US Average Annual Prices
Regular gasoline costs an average of $3.42 per gallon in the U.S., while diesel costs more, totaling $3.76 per gallon in 2024.
Gasoline Prices (2014-2024)
- In 2019, gasoline prices were $2.69 per gallon. Due to the COVID-19 pandemic in 2020, prices decreased by 16%, dropping to $2.26 per gallon.
- A rising trend was observed in 2021, with prices reaching $3.10 per gallon, marking a 37% increase from the previous year.
- By 2022, gasoline prices surged to $4.06 per gallon, a 31% increase, driven by global fuel supply chain disruptions.
- In 2023, prices declined to $3.64 per gallon, marking a 10.3% decrease from the previous year.
- Fuel prices saw a further reduction of 6.0% in 2024, settling at $3.42 per gallon.

Diesel Prices (2014-2024)
- In 2019, diesel prices stood at $3.06 per gallon. 2020 witnessed a decline of 16.7%, with prices falling to $2.55 per gallon.
- Diesel prices increased in 2021, rising 29% to $3.29 per gallon.
- An increasing trend was seen in 2022, reaching $4.99 per gallon, a 51.7% rise.
- In 2023, prices slightly dropped to $4.21 per gallon, a 15.6% decrease.
- Diesel prices saw a further reduction to $3.76 per gallon in 2024, reflecting a 10.7% decrease from the previous year.

Which state has the most expensive fuel prices in the U.S.?
California consistently has the highest fuel prices, averaging $4.85 per gallon for gasoline and $5.25 per gallon for diesel in 2024.
- Texas has some of the lowest fuel prices at $2.68 per gallon.
Gasoline Fuel
- California has the highest gasoline price at $4.85 per gallon, increasing 2.1% from 2023, largely due to high state fuel taxes, strict environmental regulations, and refining costs.
- Hawaii follows with $4.72 per gallon, experiencing a 1.8% increase, driven by reliance on imported fuel and geographic supply constraints.
- Washington reports an average gasoline price of $4.62 per gallon, reflecting a 1.5% rise, influenced by regional tax policies and transportation costs.
Diesel Fuel
- California has the highest diesel price at $5.25 per gallon, increasing 2.5% from 2023, due to high state excise taxes and refinery costs.
- Hawaii follows with $5.10 per gallon, increasing 2.0%, affected by high import costs and fuel blending regulations.
- Washington reports $4.95 per gallon, reflecting a 1.7% increase, driven by carbon pricing policies and regional fuel demand.
Household Fuel Expenditures
What is the total fuel expenditure for U.S. households each year?
In 2024, U.S. households spent approximately $2,300 per year on fuel-related expenses, reflecting a moderate decline from previous years.
- In 2015, household fuel spending was $1,900 per year. Due to the COVID-19 pandemic in 2020, travel restrictions led to a 17.4% decrease in previous spending, reducing spend to $2,148 per year.
- As restrictions eased and fuel prices surged in 2022, household fuel expenditures increased by 35%, reaching $2,900 per year.
- By 2024, total fuel spending for households dropped to $2,300, reflecting a 20.7% decrease from 2022, attributed to lower fuel prices and improved vehicle fuel efficiency.
Note: Due to limited historical data, this chart only reflects household fuel expenditures for the years 2010, 2015, 2020, 2022, and 2024.

What percentage of household expenditure is typically spent on fuel?
- In 2024, 3.5% of U.S. household expenditure goes towards fuel, with variations depending on location and vehicle type.
Practical Consumer Tips
When are the cheapest days to buy fuel in the U.S.?
- As of 2024, the cheapest day to buy fuel in the U.S. is typically Monday, while Thursday is often the most expensive.
- This trend is influenced by mid-week price resets and weekend demand surges.
Which mobile apps provide real-time tracking of fuel prices?
- GasBuddy: Provides real-time price tracking, user-reported updates, and discount programs.
- AAA Mobile App: Offers up-to-date fuel prices along with travel planning tools.
- Google Maps: Displays fuel prices at nearby stations, updated regularly.
Driving and Efficiency
How can changes in driving habits reduce overall fuel expenses?
- Avoid aggressive driving: Hard acceleration and braking can reduce fuel efficiency by up to 30% on highways and 40% in city traffic.
- Limit idling: Idling for over a minute wastes fuel—turn off the engine when parked.
- Use cruise control: Helps maintain a steady speed, reducing unnecessary fuel burn.
- Drive at moderate speeds: Fuel economy significantly drops at speeds above 50 mph.
- Combine trips: Short trips from a cold start use twice as much fuel as a single long trip.
What maintenance tips help maximize vehicle fuel efficiency?
- Check tire pressure regularly: Under-inflated tires can reduce fuel efficiency by 3-5%.
- Use manufacturer-recommended motor oil: Reduces engine friction and enhances efficiency.
- Replace air filters if dirty: A clean air filter improves fuel economy and engine performance.
- Ensure timely tune-ups: Replacing faulty spark plugs can improve fuel efficiency by up to 4%.
- Keep cargo weight minimal: Removing unnecessary weight and roof racks can improve mileage by up to 8%.
Government Policies and Fuel Price Regulation
How do the U.S. fuel regulations and taxes affect fuel prices?
- Federal fuel tax: The federal tax rate is $0.184 per gallon for gasoline and $0.244 per gallon for diesel.
- State and local taxes: Average an additional $0.34 per gallon, leading to regional price variations.
- Regulatory requirements: Seasonal fuel blend regulations (such as summer fuel blends) increase costs in some states.
- Renewable Fuel Standard (RFS): This mandates ethanol blending in gasoline, impacting supply chain logistics and prices.
What is the outlook for future government policy regarding fuel pricing?
- Fuel efficiency standards: Stricter Corporate Average Fuel Economy (CAFE) standards aim to improve vehicle fuel economy, reducing long-term fuel demand.
- Expansion of EV incentives: Government policies are promoting electric vehicles (EVs) with tax credits and infrastructure development.
- No immediate federal fuel tax increase: While some states are increasing fuel taxes, the federal rate has remained unchanged since 1993.
- Potential oil market volatility: Fuel prices may fluctuate due to geopolitical tensions, global crude supply, and refining capacity constraints.
Fuel Cost Statistics Resources
Global Statistics Resources
Car Sales:
- Automotive Industry Trends
- Global Car Sales 2024
- Global Car Sales by Brands
- Global Car Sales by Car Models
Car Rentals:
EV Sales:
- Global EV Sales by Automaker
- Global EV Sales by Country (incl. AU, CA, CH, DE, JP, NO, UK)
- Global EV Sales by Type
- EV Statistics by Automaker (incl. BYD, Tesla)
References
EIA: U.S. fuel price trends, historical gasoline and diesel prices, and state-by-state breakdown.
BLS: Household fuel expenditure trends and percentage of income spent on fuel.
GB: Weekly fuel price fluctuations.
GPP: U.S. vs. global fuel price comparisons and tax policy impacts.
GB: Cheapest Prices per day in the US