

 Popular Countries
 24/7 Support
Published
Bergen Airport, Flesland (BGO), is Norway’s second-largest airport and serves as the main aviation gateway to Western Norway. Operating as a key hub for the economically important west coast, the airport connects over 600,000 residents across Hordaland and Sogn og Fjordane counties to both domestic and international destinations.
How many passengers pass through Bergen Airport each year?
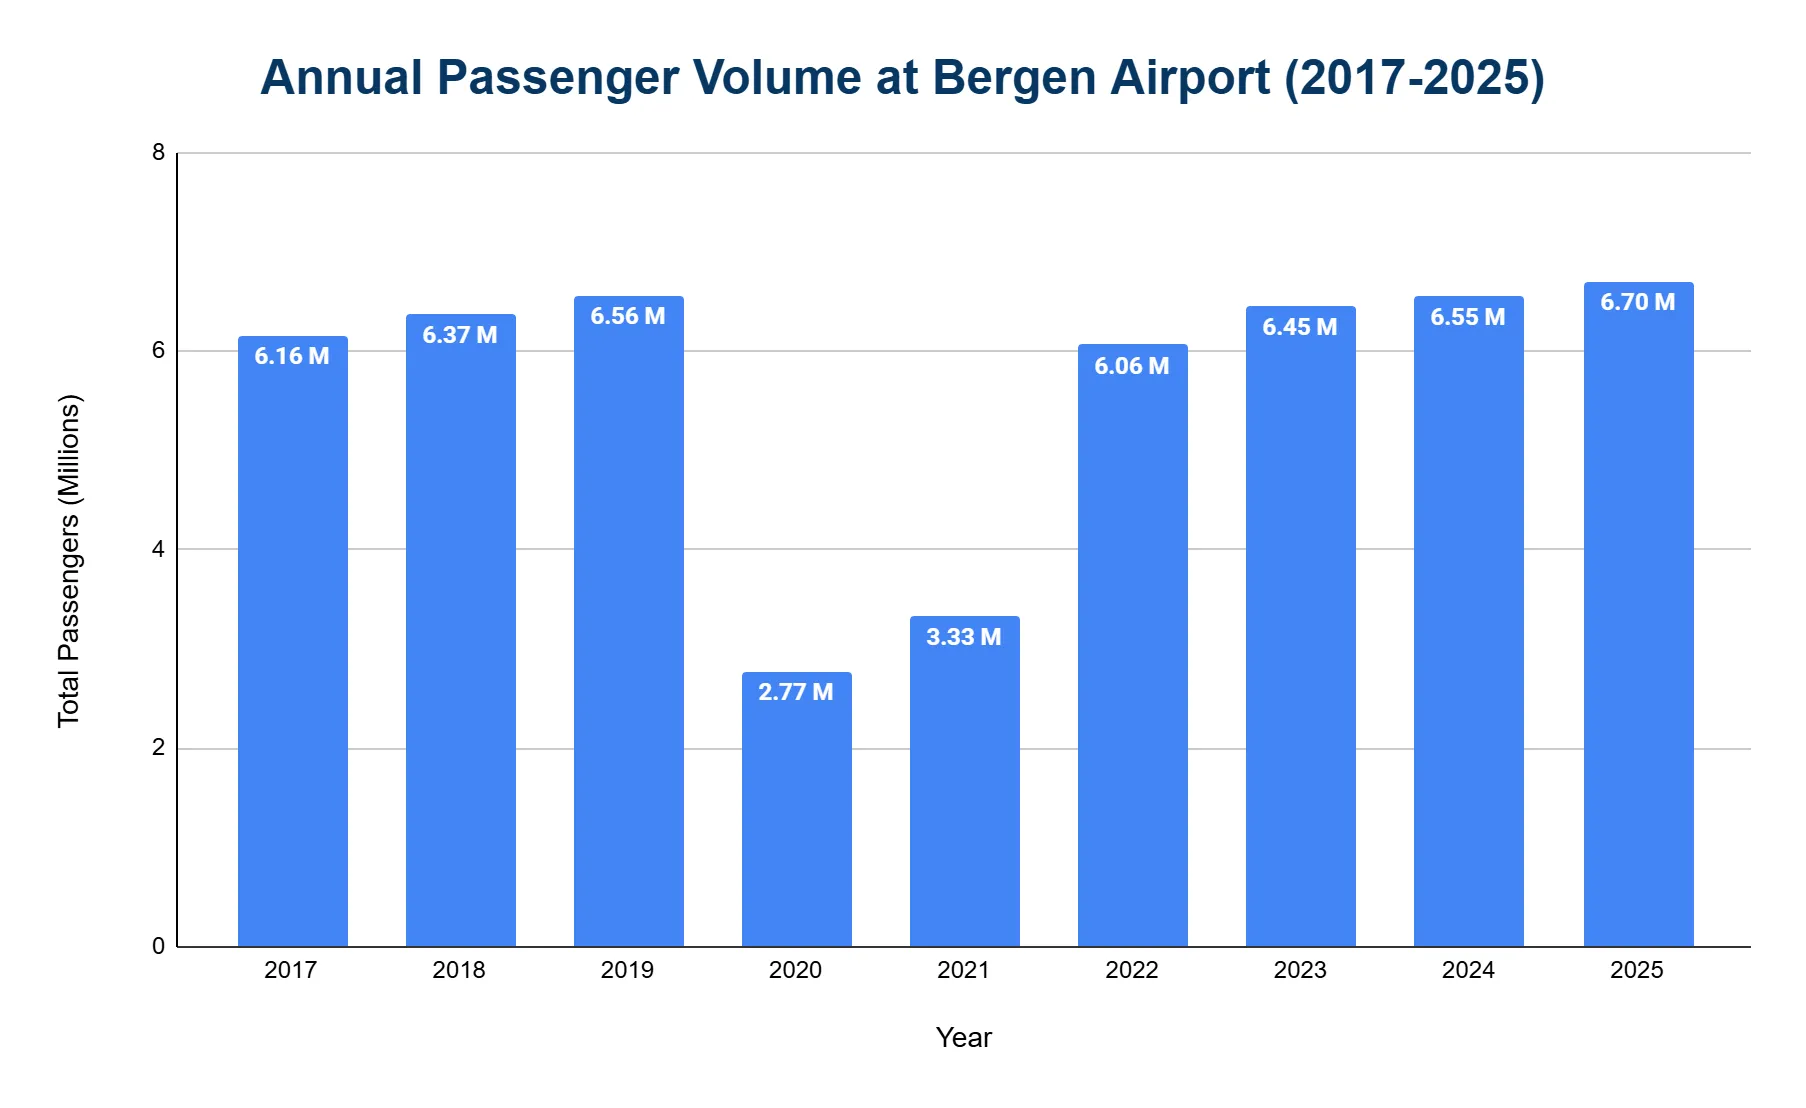
Bergen Airport handles over 6 million passengers annually, reflecting a strong recovery from the pandemic and surpassing pre-COVID peak levels.
- In 2025, BGO processed 6.70 million passengers, a 2.3% increase from 6.55 million in 2024, reaching 102.1% of pre-pandemic volumes.
- The 2019 record stood at 6.56 million passengers.
- Passenger numbers dropped to 2.77 million in 2020, a 57.8% decline due to COVID-19.
- Traffic rebounded to 3.33 million in 2021, then 6.06 million in 2022 and 6.45 million in 2023, showing steady year-over-year growth.
Domestic vs International Passengers
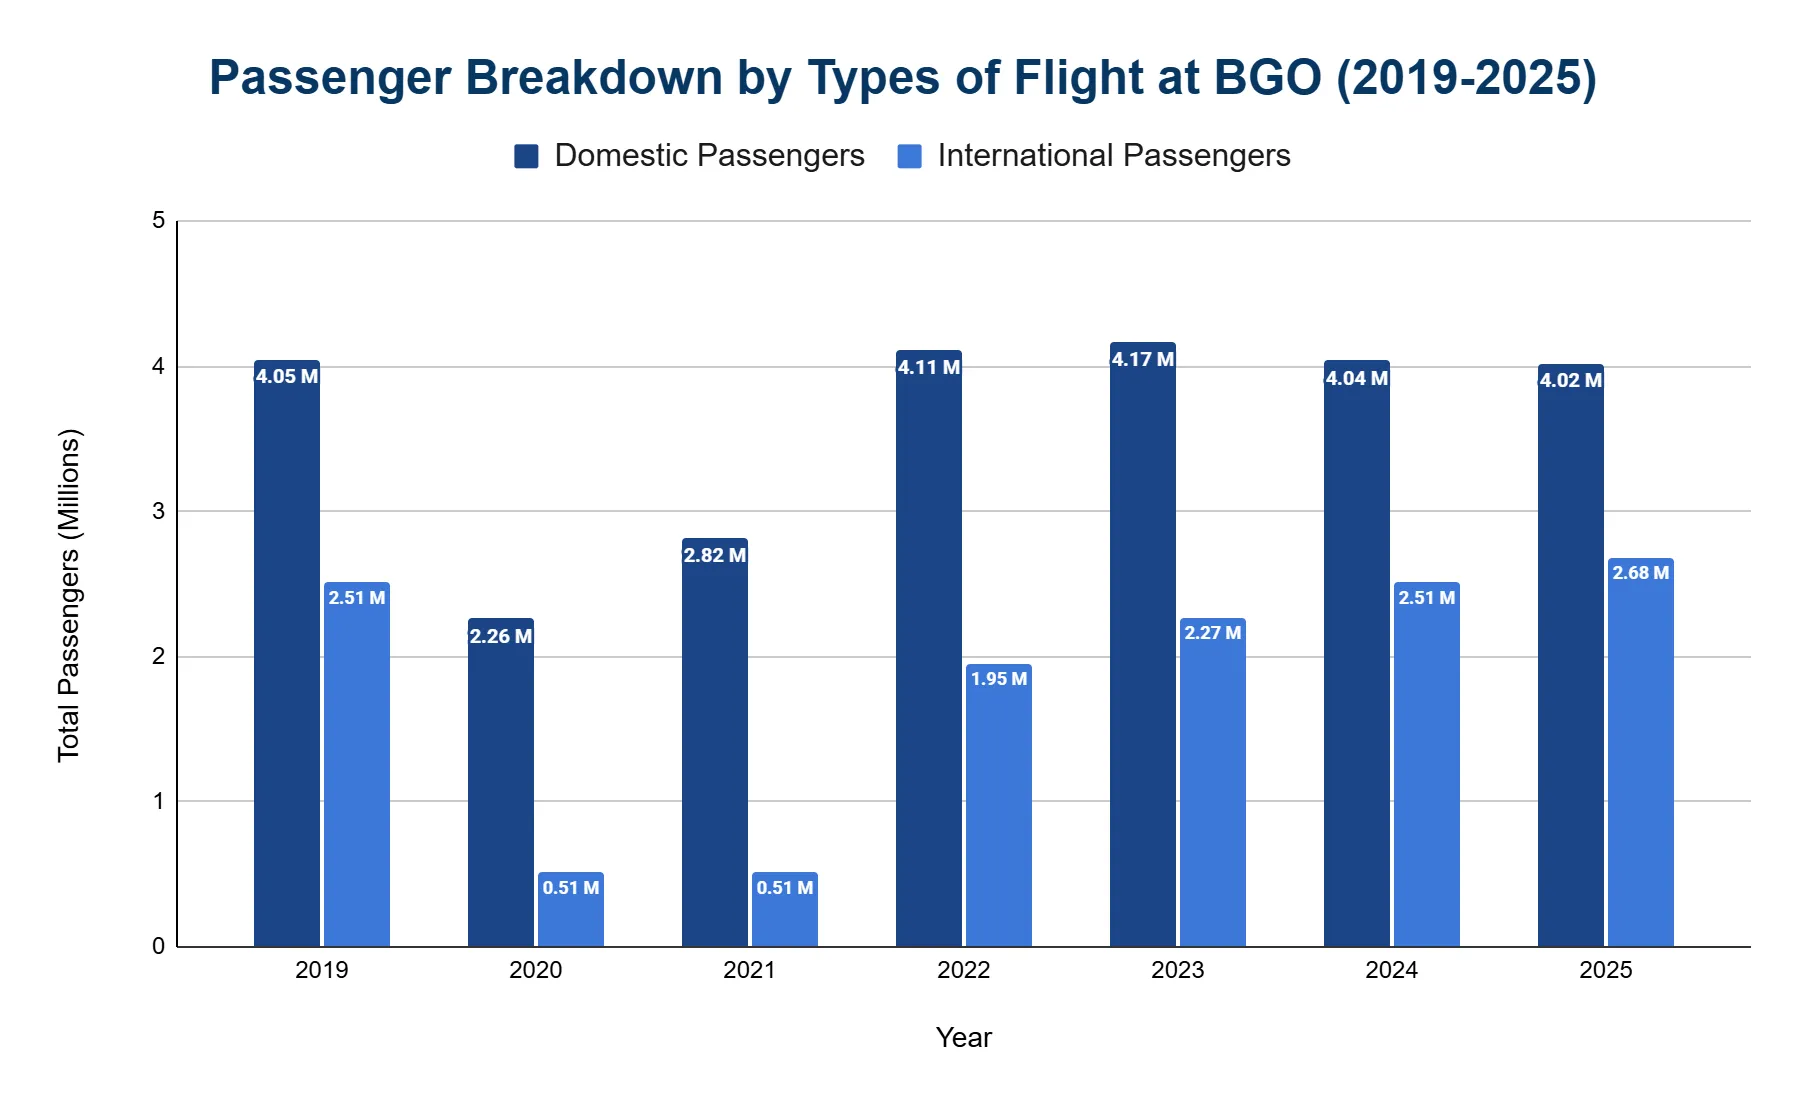
Bergen Airport has seen a shift in passenger trends, with international traffic gaining a larger share. This aligns with its growing role as Norway's "Gateway to the Fjords."
- 2.68 million passengers traveled through international flights in BGO in 2025, making up 40% of total traffic.
- Domestic passengers totaled 4.02 million, or 60% of all traffic.
- In 2019, the split was 61.8% domestic and 38.2% international, showing stable proportions over time.
What is the total number of aircraft operations at Bergen Airport each year?
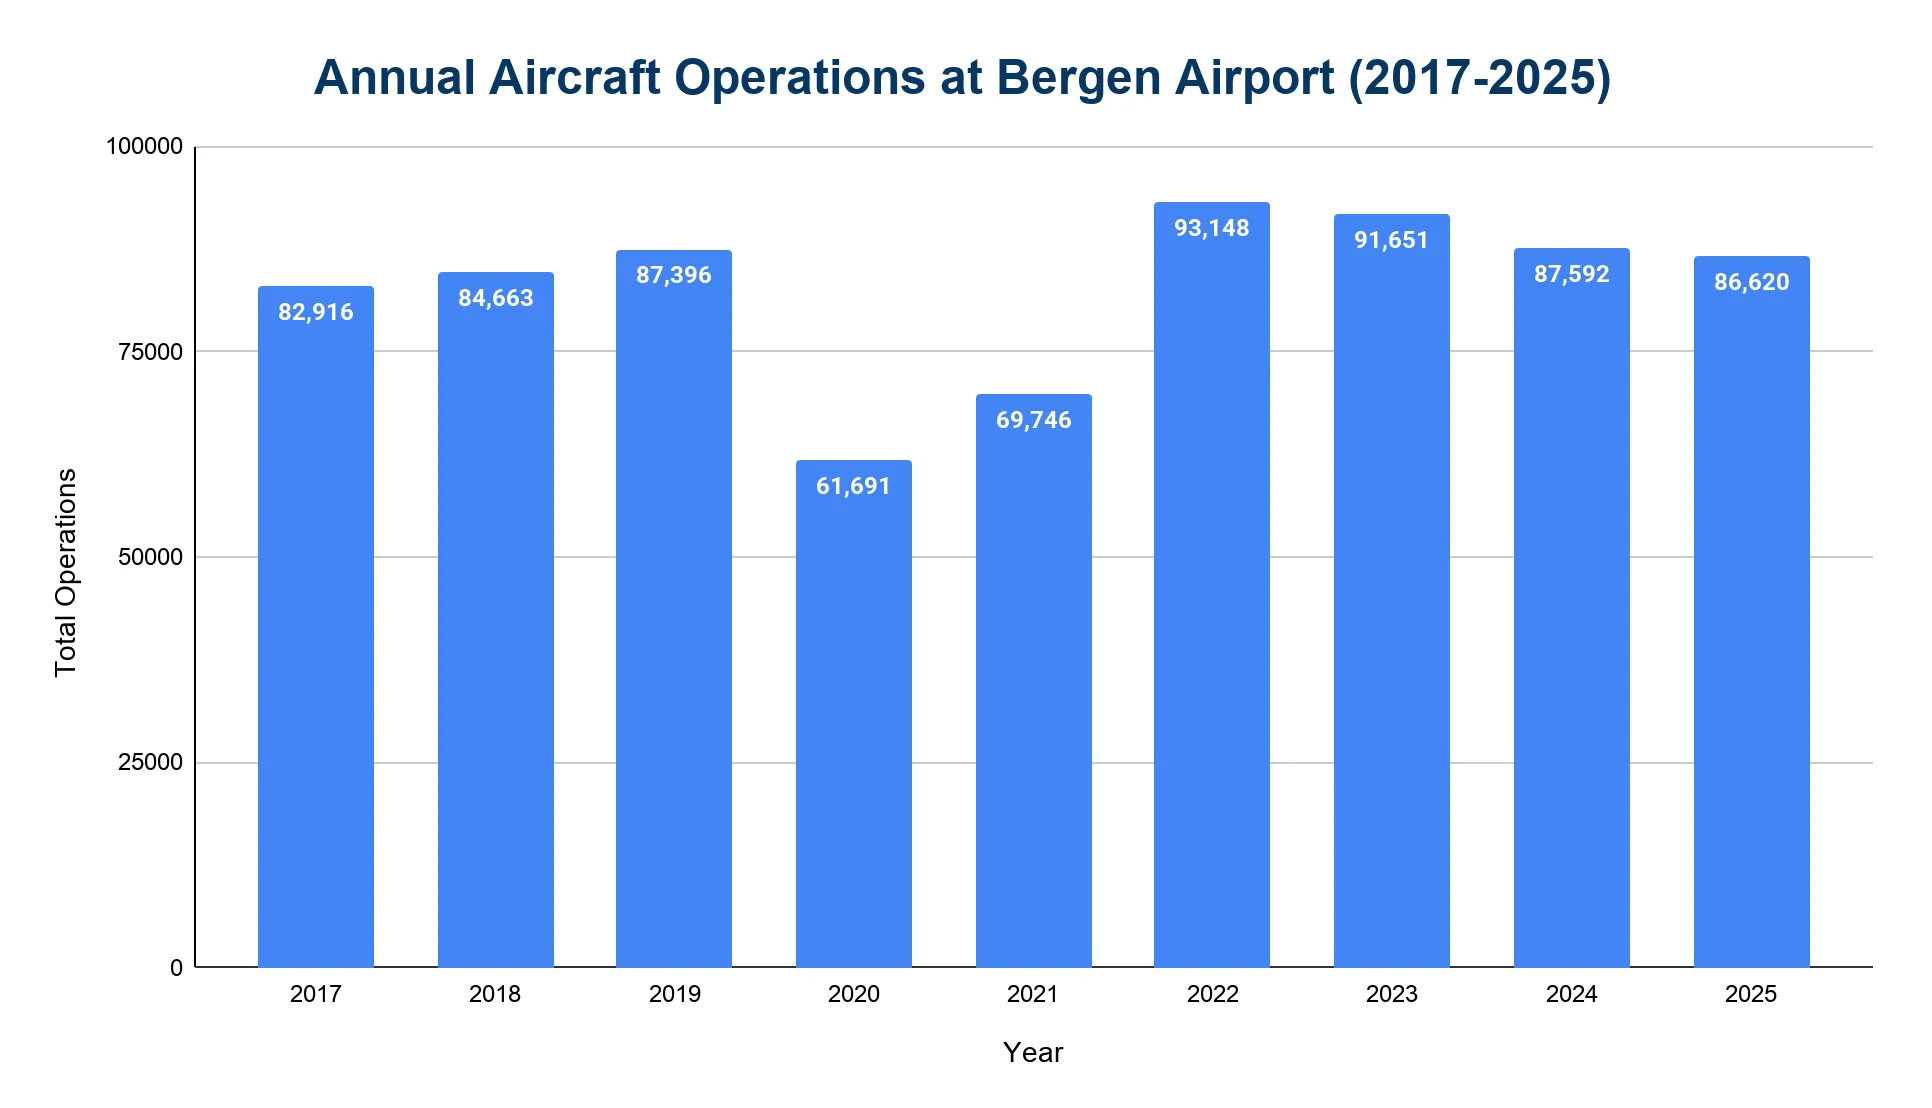
Bergen Airport records over 85,000 aircraft operations annually. Despite rising passenger numbers, aircraft movements have declined over the decade, indicating better efficiency.
- BGO logged 86,620 aircraft movements in 2025, a 1.1% decrease from 87,592 movements in 2024.
- Movements peaked at 96,371 in 2014, falling to 87,396 by 2019.
- The lowest point came in 2020, with 61,691 movements due to travel restrictions.
- Recovery began with 69,746 in 2021, increasing to 93,148 in 2022 and 91,651 in 2023, both surpassing pre-pandemic levels.
International vs Domestic Operations
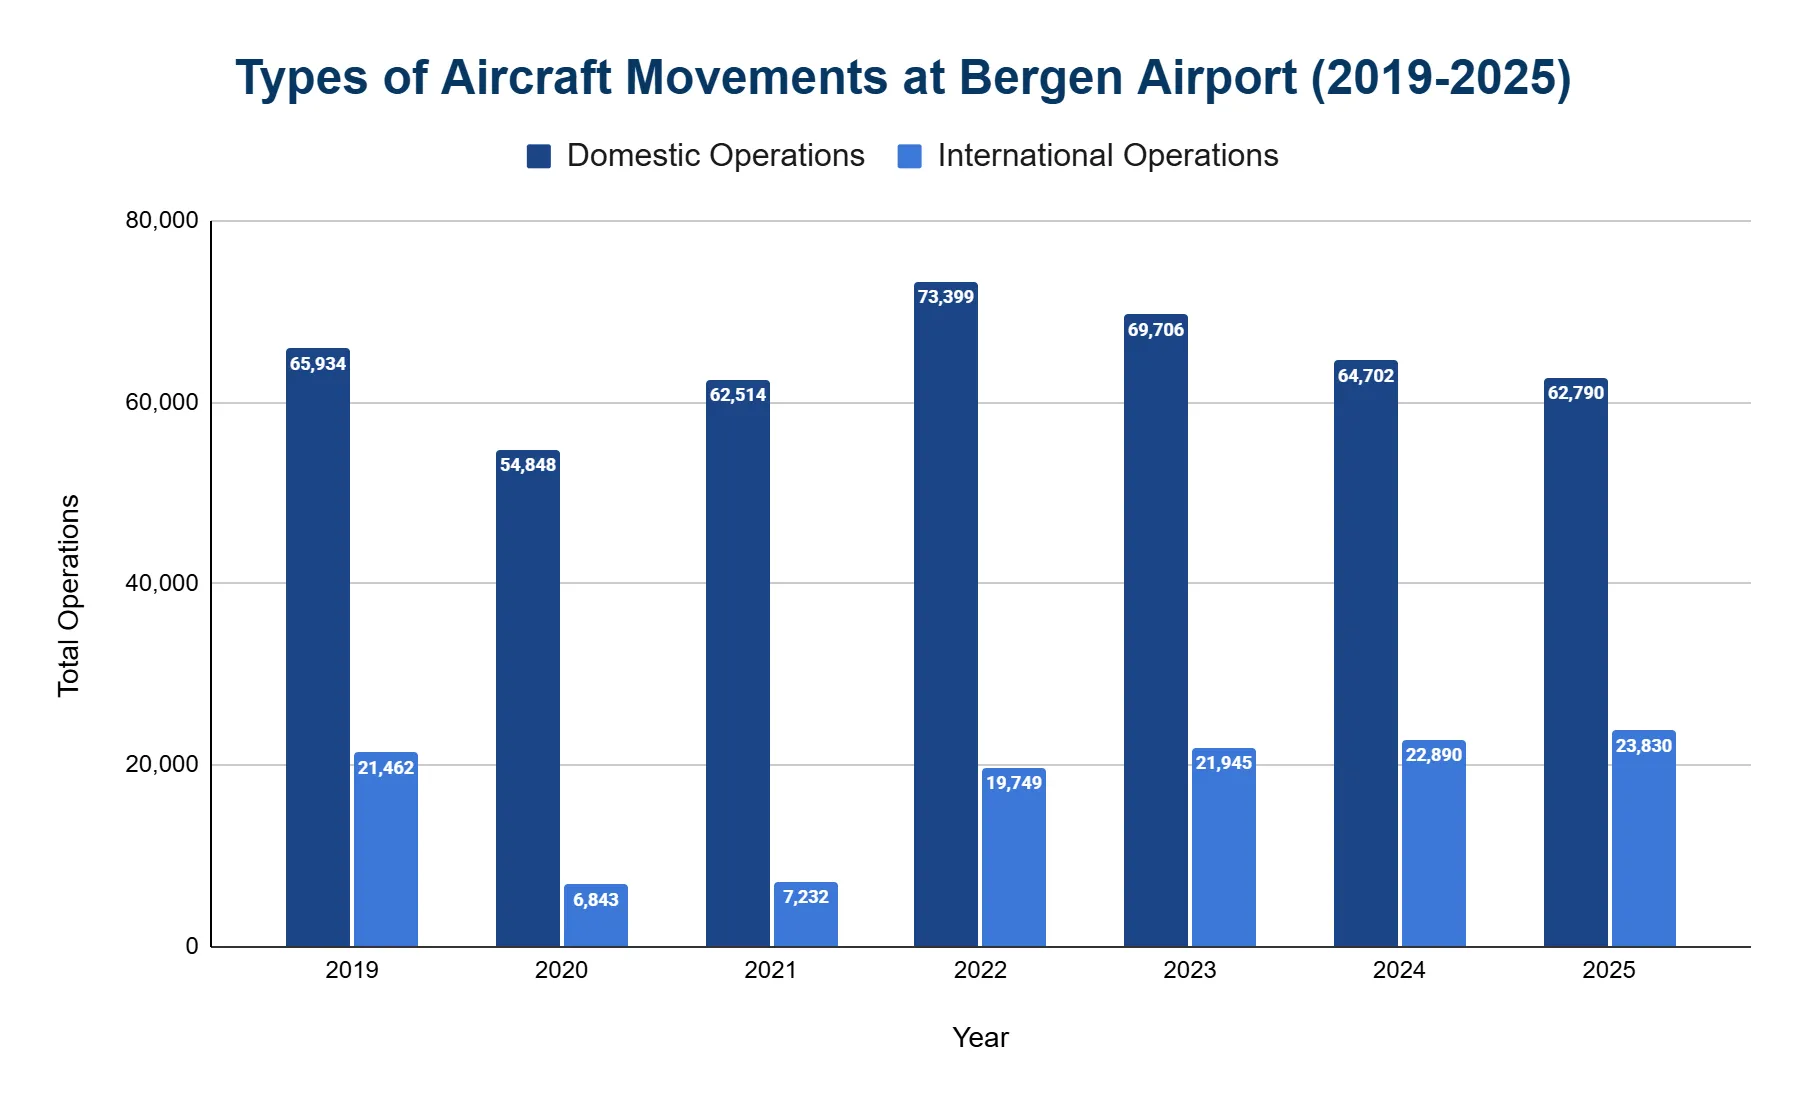
Domestic operations still make up the majority of flights at Bergen Airport, though international flights have recovered more quickly.
- In 2025, domestic operations reached 62,790, or 72.5% of total movements.
- International operations totaled 23,830, making up 27.5%.
- In 2019, there were 65,934 domestic and 21,462 international operations, reflecting similar distribution.
- International flights returned to pre-pandemic levels faster than domestic services.
Which airlines operate the most flights out of Bergen Airport?
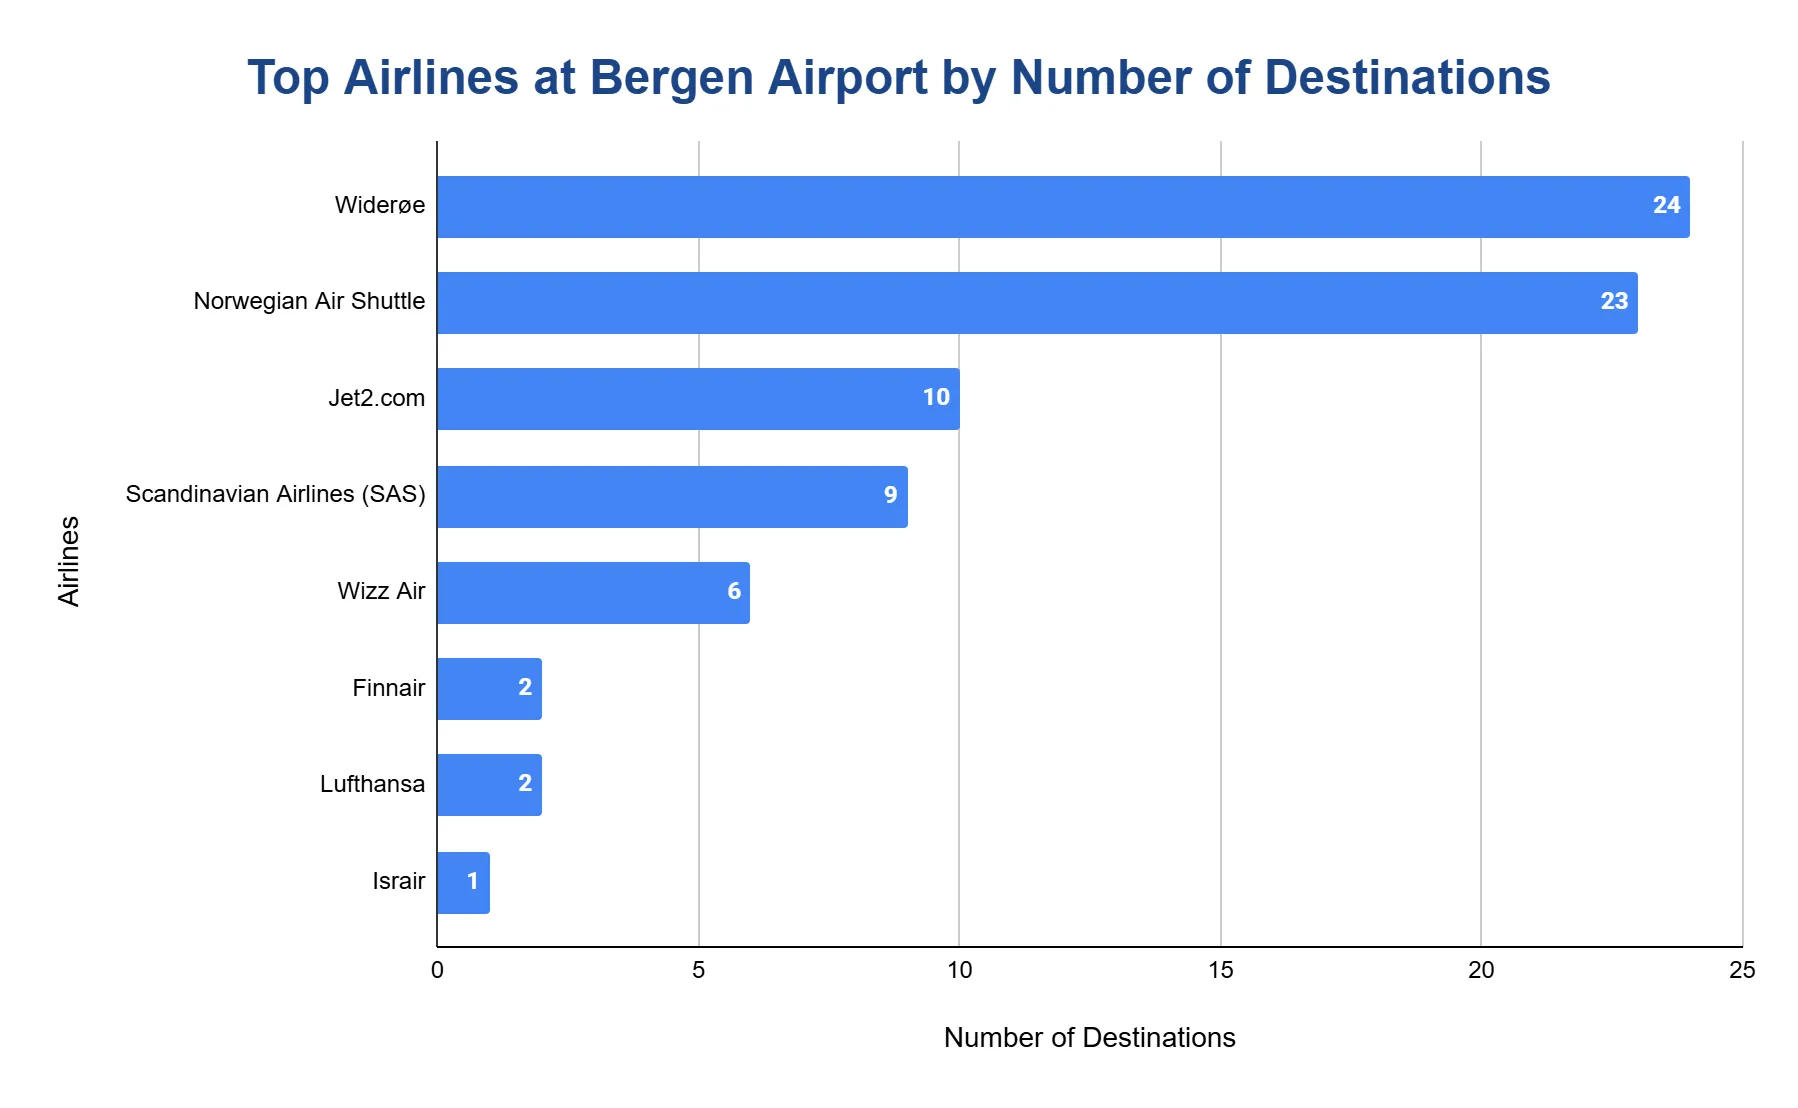
Norwegian Air Shuttle, Scandinavian Airlines (SAS) and Widerøe are the top carriers at Bergen Airport, each serving different market segments.
- Widerøe operates 24 direct routes and is the largest by destination count, focusing on regional domestic links.
- Norwegian Air Shuttle serves 23 direct routes, with strong presence on domestic trunk lines and European leisure destinations.
- Jet2.com offers 10 routes, mainly to UK leisure markets.
- SAS runs 9 direct routes, with high-frequency service to major cities and international hubs.
What are the monthly trends in passenger traffic?
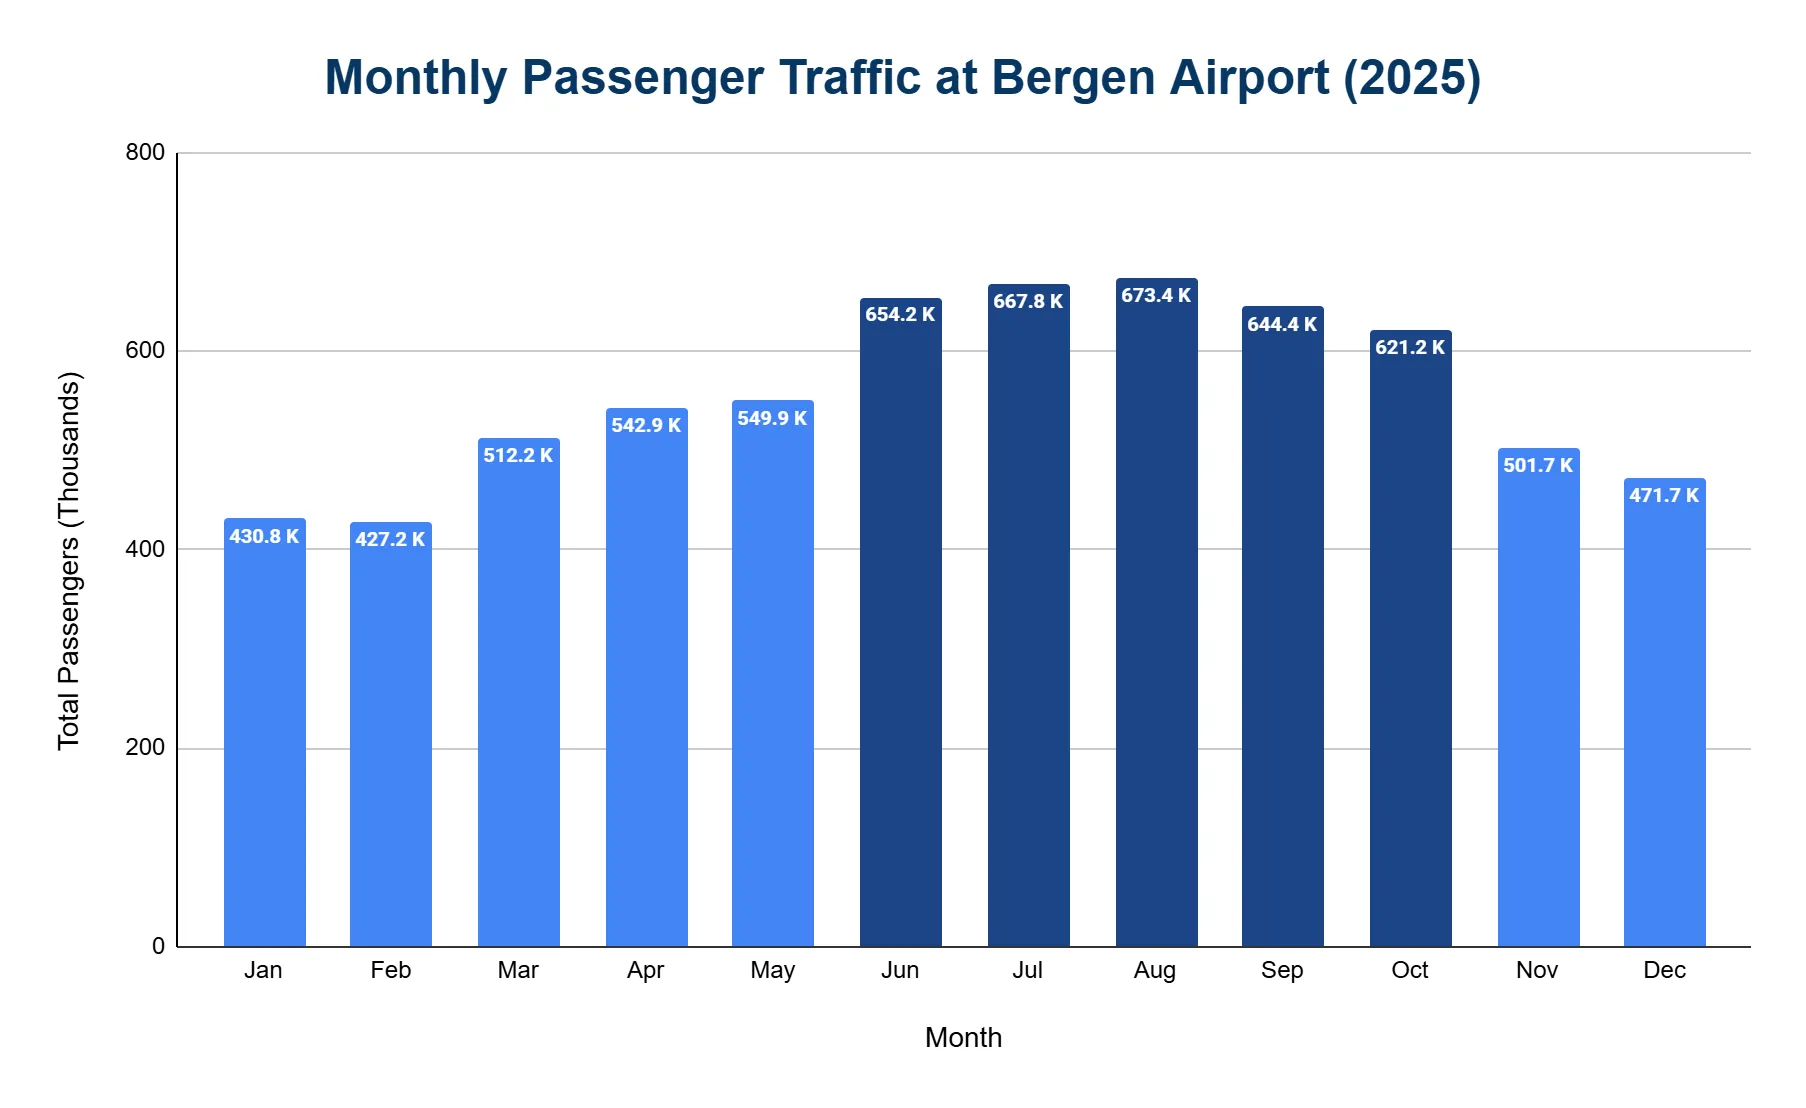
Bergen Airport sees its highest passenger volumes between June and October, with each of these months exceeding 600,000 passengers in 2025.
- August was the busiest month, with 673,353 passengers.
- July followed with 667,754, then June with 654,227 and September with 644,423.
- In contrast, January and February were quieter, with 430,803 and 427,177 passengers, respectively.
How many routes are there at Bergen Airport?
Bergen Airport maintains a broad network of domestic and international destinations.
- 64 non-stop destinations across 20 countries make up the current scheduled network.
- 16 domestic routes ensure critical connectivity across Norway’s challenging terrain.
- 48 international routes link to markets in Europe, North America and Asia.
- The core year-round network includes about 30 routes, with additional seasonal and charter services.
Which destinations are the most popular from Bergen Airport?
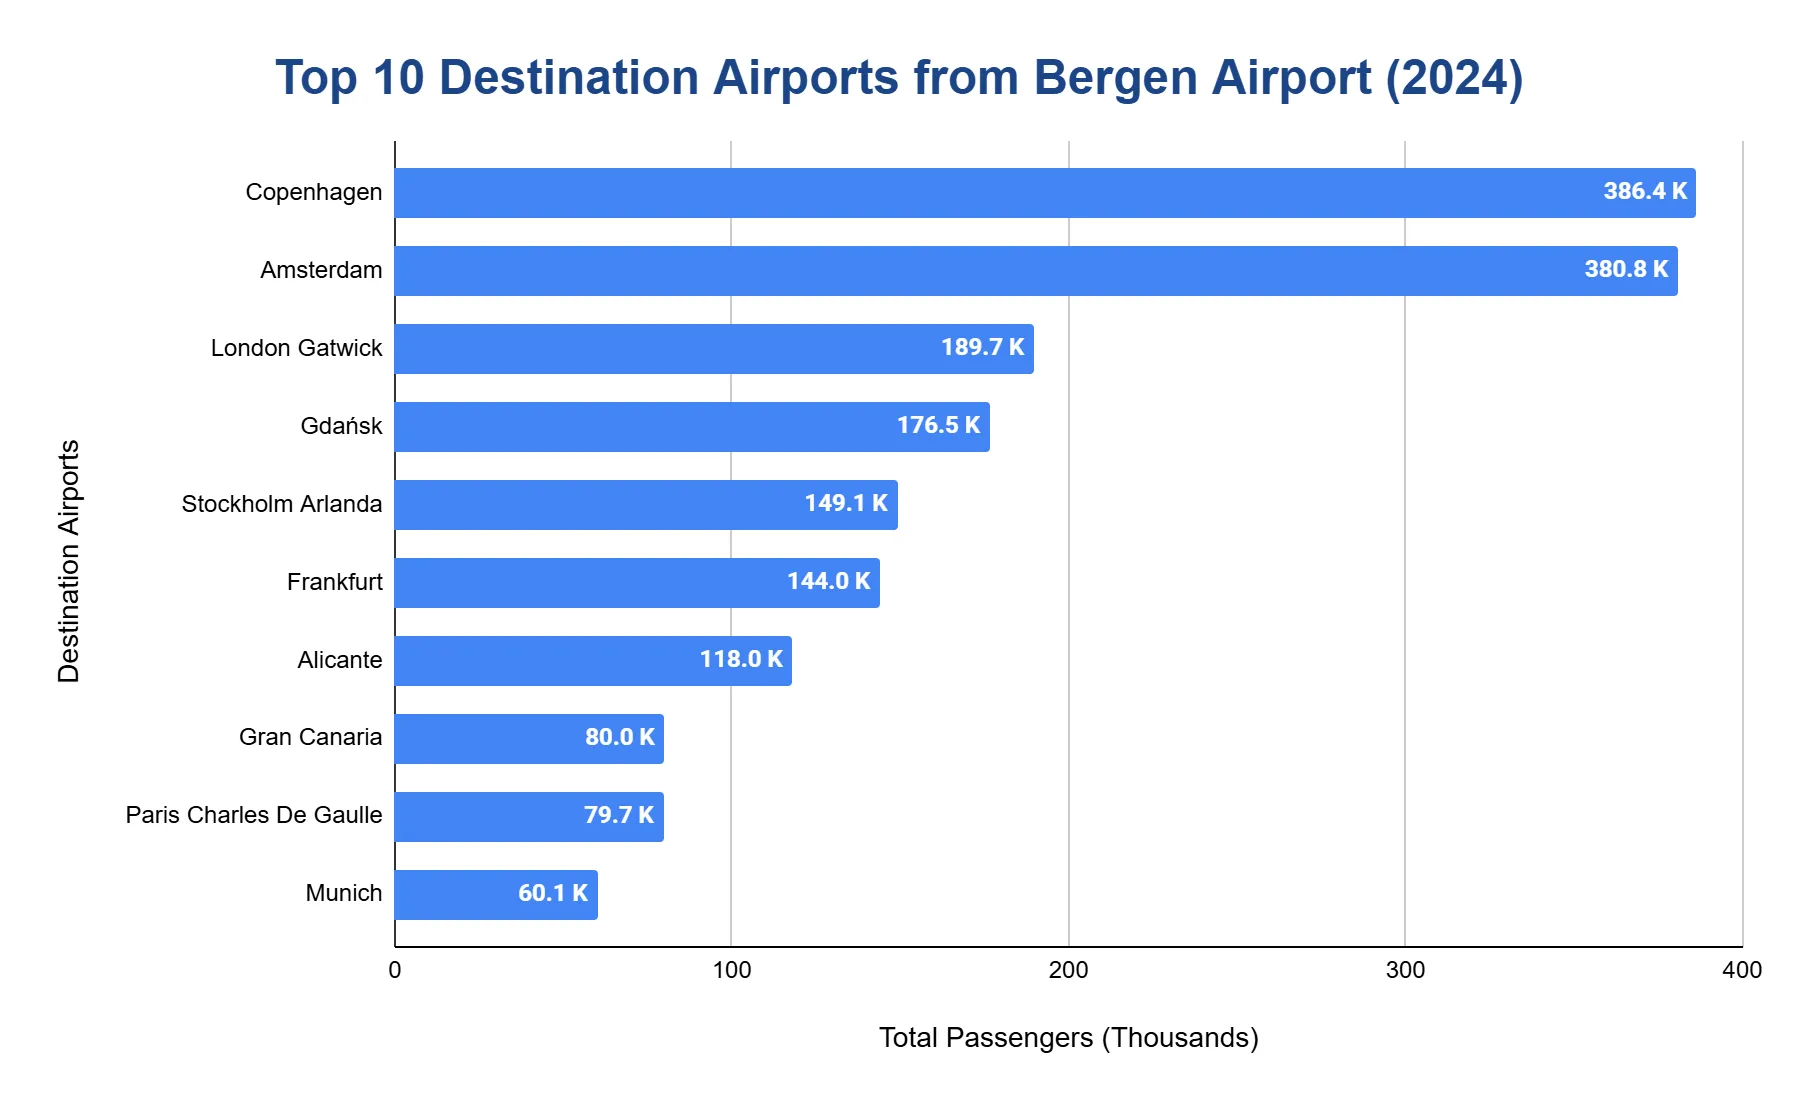
- Copenhagen (CPH) served as the top international destination in 2024 with 386,439 passengers, providing primary European hub access.
- Amsterdam (AMS) routes handled 380,761 passengers, serving as a key Netherlands gateway.
- London Gatwick (LGW) maintained 189,670 passengers, connecting to the United Kingdom's capital.
- Gdańsk (GDN) and Stockholm (ARN) completed the top 5 with 176,497 and 149,102 passengers.
How much cargo does Bergen Airport handle annually?
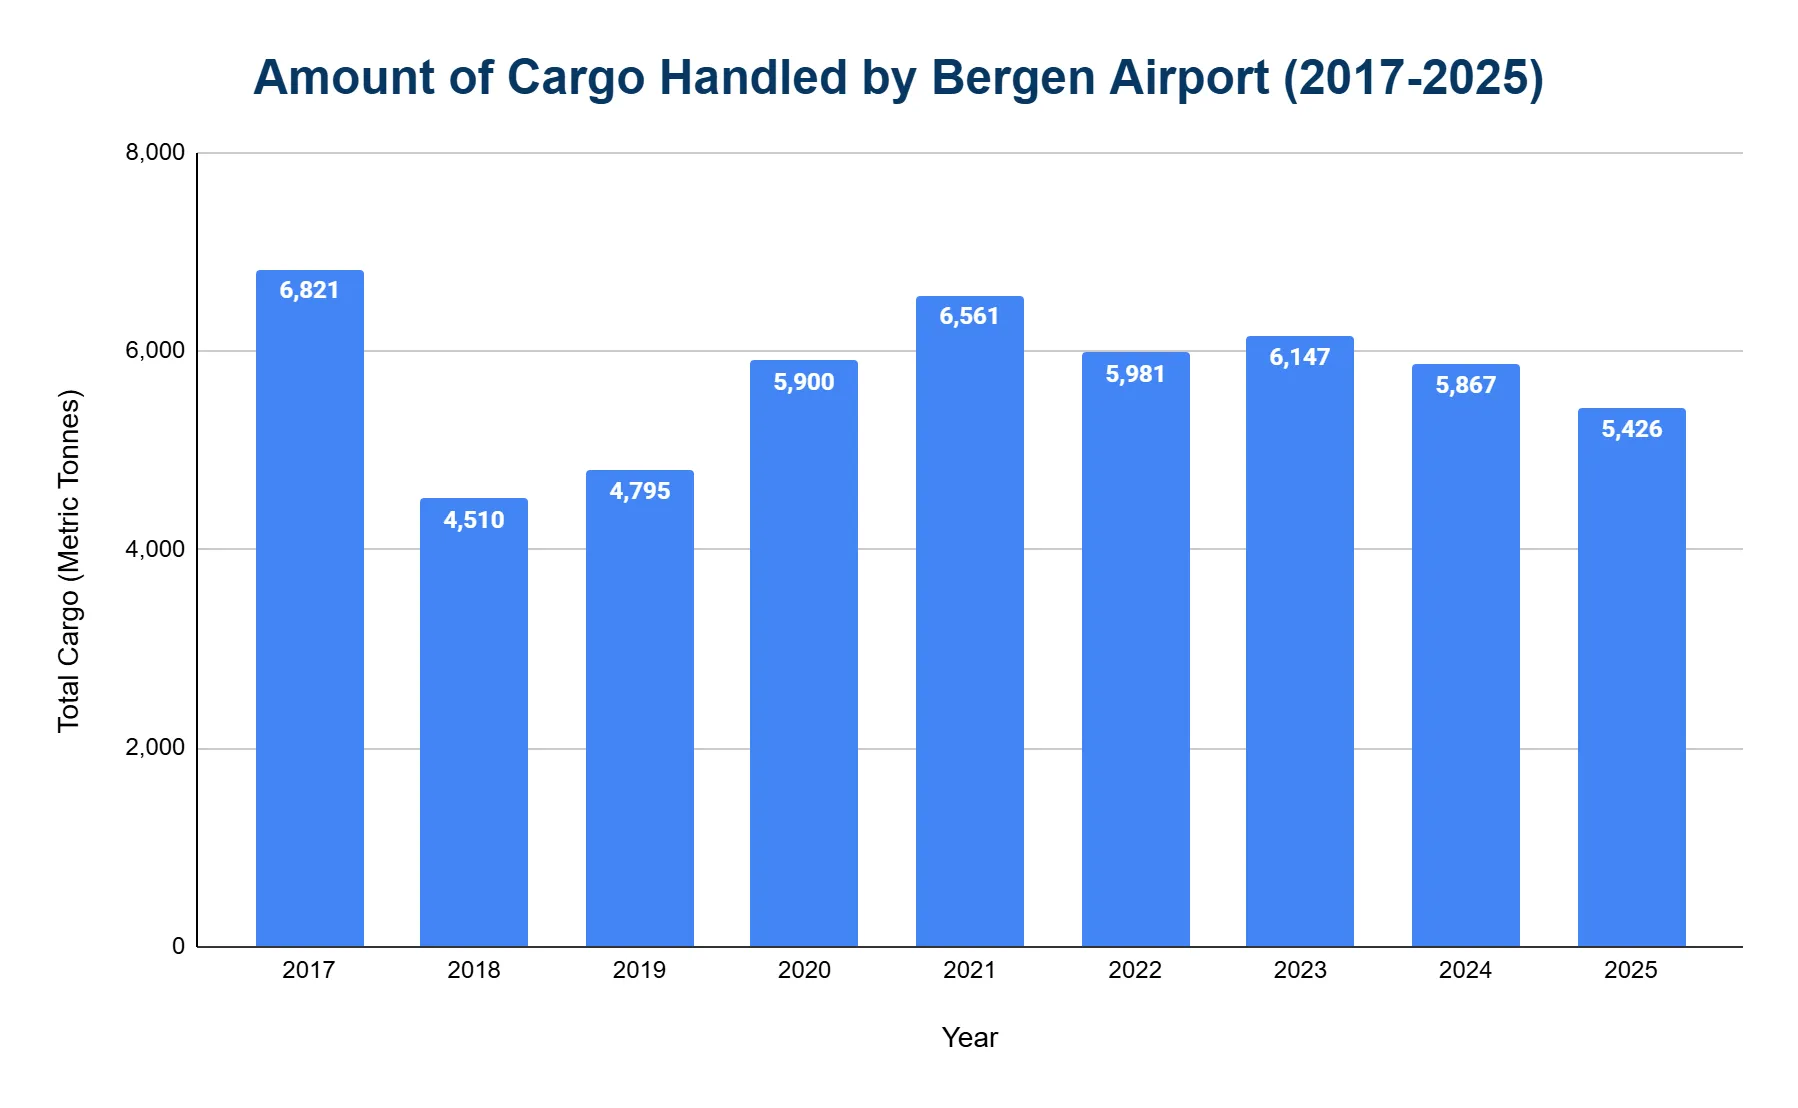
Bergen Airport handles around 5,000 metric tonnes of cargo each year. While the volume is modest, the airport plays a key role in exporting high-value perishable goods.
- In 2025, 5,426 metric tonnes were handled, a 7.5% drop from 5,867 metric tonnes 2024.
- Cargo peaked at 8,459 metric tonnes in 2014, then fell to 4,795 metric tonnes by 2019.
- During the pandemic, volumes rose to 5,900 metric tonnes in 2020 and peaked at 6,561 metric tonnes in 2021.
- The figures moderated to 5,981 metric tonnes in 2022 and 6,147 metric tonnes in 2023.
What are the main causes of flight disruptions at Bergen Airport?
- Fog, high winds and heavy precipitation frequently disrupt flights due to the airport’s coastal setting.
- Icing is the most serious weather-related risk, especially in winter, requiring frequent de-icing.
- Air Traffic Control congestion and crew scheduling issues also cause airline-related delays.
- Technical issues and late-arriving aircraft often lead to cascading delays across the schedule.
Related Travel Statistics
- Brussels Airport Statistics
- Dubrovnik Airport Statistics
- Split Airport Statistics
- Malta Airport Statistics
- Oslo Airport Statistics
- Lisbon Airport Statistics
- Madeira Airport Statistics
- Porto Airport Statistics
- Hamad International Airport (DOH) Statistics
- Seoul Gimpo Airport Statistics
- Geneva Airport Statistics
- Dubai International Airport (DXB) Statistics
How much revenue has Bergen Airport generated each year?
Bergen Airport is part of the state-owned Avinor Group, contributing to its nationwide airport funding model.
- Avinor generated NOK 12.11 billion in 2024, a 5.2% increase from 2023.
- Bergen ranks among the top profit-generating airports in the group, alongside Oslo, Stavanger and Trondheim.
What are the notable incidents at Bergen Airport?
- January 20, 2020: A Widerøe DHC-8-300 experienced a temporary dual-engine flameout on approach due to severe icing with supercooled large droplets. The crew restarted the engines and landed safely.
- November 9, 2007: A Danish Air Transport ATR-42-300 took off prematurely and entered an uncontrolled climb caused by ice on the tail, despite recent de-icing.
- 1996: A Cessna 208 Caravan cargo aircraft crashed shortly after takeoff due to ice accumulation on wings and tail. The aircraft had not been de-iced and the crash was fatal.
References
- Statistics Norway (SSB) — Bergen Airport air-traffic statistics · ssb.no
- FlightConnections — airlines and routes from Bergen Airport · flightconnections.com
- Eurostat — Air passenger transport (avia_pa) · ec.europa.eu
- Avinor — Group annual revenue · avinor.no
- Norwegian Safety Investigation Authority (NSIA) — Bergen Airport incidents · nsia.no

