

 Popular Countries
 24/7 Support
Published
Oslo Airport (OSL) is Norway’s main international gateway and the second busiest airport in Scandinavia. Operated by the state-owned company Avinor, it serves as a primary hub for Scandinavian Airlines (SAS) and a key base for Norwegian Air Shuttle, Norse Atlantic Airways and regional carrier Widerøe.
How many passengers pass through Oslo Airport each year?
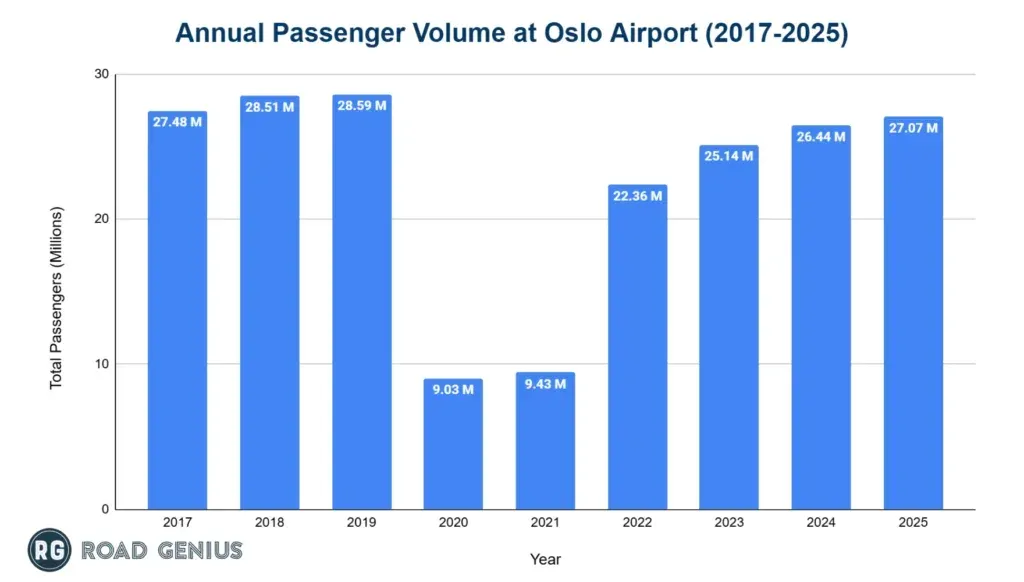
Oslo Airport handles over 25 million passengers annually, reflecting a steady recovery from pandemic lows though still below pre-pandemic highs.
- OSL processed 27.07 million passengers in 2025, a 2.4% increase over the 26.44 million recorded in 2024, reaching 94.7% of 2019 levels.
- The airport’s all-time high was 28.59 million passengers in 2019 before the COVID-19 pandemic triggered a sharp decline.
- Passenger numbers fell by 68% to 9.03 million in 2020, one of the steepest drops among major European airports.
- Recovery began in 2021 with 9.43 million passengers, then rose to 22.36 million in 2022 and 25.14 million in 2023.
How many Domestic vs International Travelers does Oslo Airport serve?
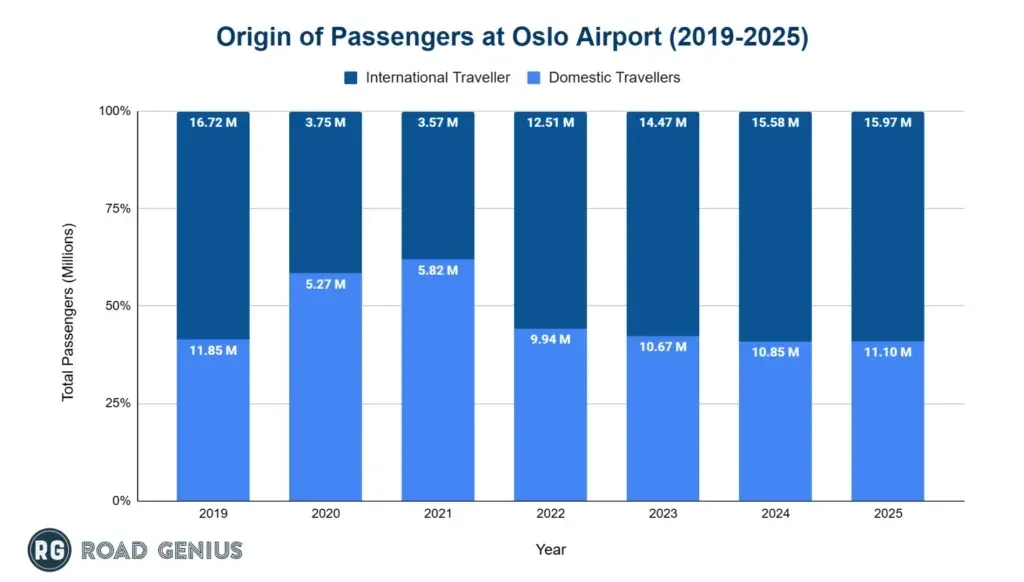
Oslo Airport has a predominantly international passenger base, with international travel outpacing domestic recovery.
- In 2025, international travelers made up 59% of total traffic, with 15.97 million passengers compared to 11.1 million domestic.
- International traffic across the Avinor network grew by 2.5%, while domestic traffic rose only 2.3%.
What is the total number of aircraft operations at Oslo Airport each year?
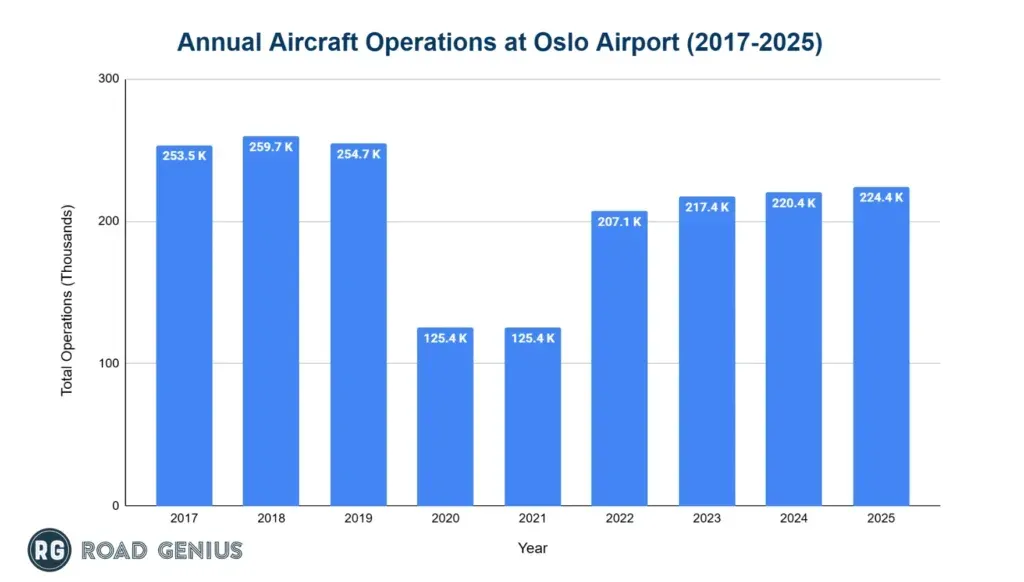
Oslo Airport sees more than 200,000 aircraft operations per year, with passenger growth primarily driven by higher load factors instead of increased flight frequency.
- The airport recorded 224,416 aircraft movements in 2025, a 1.8% increase from 220,371 in 2024 and reaching 88.1% of pre-pandemic levels.
- The peak was 254,659 movements in 2019, followed by a sharp decline to 125,428 in 2020 and 125,394 in 2021.
- Operations rebounded to 207,133 in 2022 and 217,399 in 2023.
International vs Domestic Operations
The split in flight operations mirrors the passenger profile, with international flights forming the majority.
- In 2025, international movements accounted for 53.2% of all flights, totaling 119,437 operations, boosted by new carriers such as easyJet, Transavia and Volotea and the return of long-haul services.
- Domestic flights made up 43.5%, or 97,520 operations, supporting connectivity to Norwegian cities and regions.
- Other operations, including cargo, charter and general aviation, comprised 3.3%, totaling 7,459 flights.
| Number of Operations by Flow of Aircraft (2019-2025) | |||
|---|---|---|---|
| Year | Domestic | International | Other |
| 2019 | 111,577 | 132,837 | 10,245 |
| 2020 | 71,870 | 45,248 | 9,310 |
| 2021 | 73,929 | 44,784 | 6,681 |
| 2022 | 96,249 | 102,960 | 7,924 |
| 2023 | 95,628 | 114,115 | 7,656 |
| 2024 | 95,257 | 118,311 | 6,802 |
| 2025 | 97,520 | 119,437 | 7,459 |
Source · Avinor, Oslo Airport traffic statistics
Which airlines operate the most flights out of Oslo Airport?
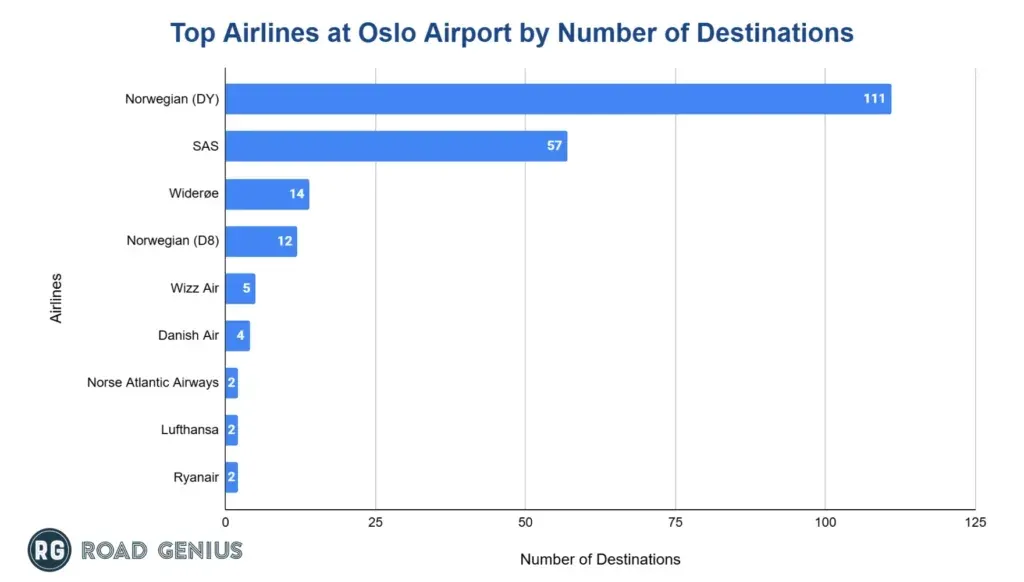
Norwegian Air Shuttle has become the leading carrier at Oslo Airport, surpassing SAS in the post-pandemic shift.
- Norwegian Air Shuttle ASA operates the most flights at Oslo Airport, serving 111 destinations.
- Scandinavian Airlines (SAS) ranked second with 57 destinations.
- Widerøe and Norwegian Air International connect to 14 and 12 destinations, respectively.
- Wizz Air completes the top 5 list with 5 destinations.
What are the monthly trends in passenger traffic at Oslo Airport?
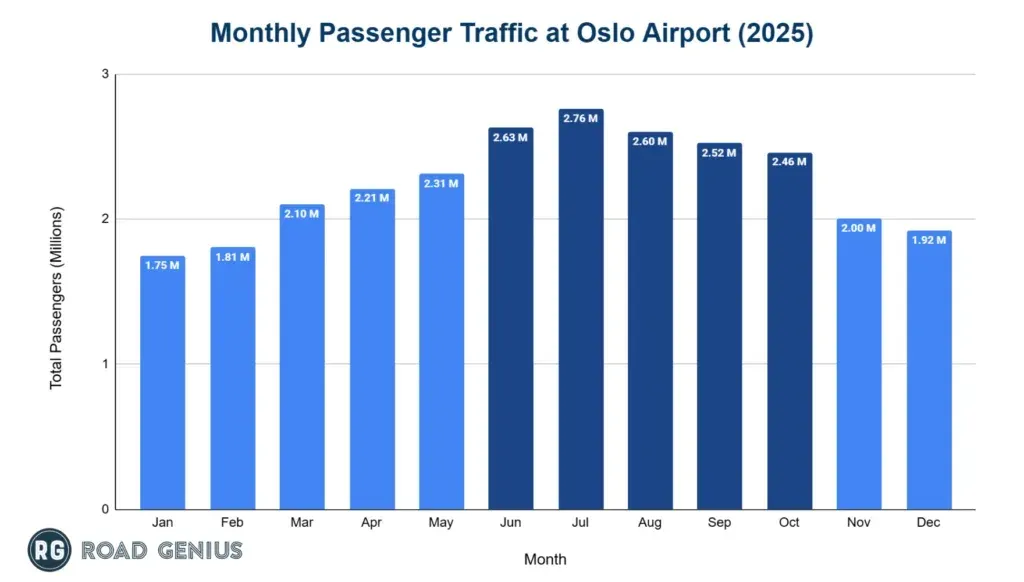
Summer is the peak travel season at Oslo Airport, with June through August seeing the highest passenger numbers due to outbound tourism and inbound visitors.
- July recorded 2.76 million passengers in 2025, marking the month as the busiest month of the year.
- June and August were other months that crossed the 2.6 million threshold in 2025, with 2.63 million and 2.6 million passengers, respectively.
- September and October completed the top 5 busiest months with 2.52 million and 2.46 million passengers, respectively.
- Meanwhile, January and February were the quietest months with 1.75 million and 1.81 million passengers.
How many routes are there at Oslo Airport?
- As of 2024, Oslo Airport connects to 164 destinations, including 31 domestic and 133 international routes.
- This marks a 13% increase from 2014 when the network included 145 destinations.
- Growth has been driven largely by international routes, with the addition of low-cost carriers and resumed long-haul services.
- OSL also acts as a connecting hub for flights to both Norwegian regional airports and international destinations beyond Europe.
Which destinations are the most popular from Oslo Airport?
Domestic Destinations
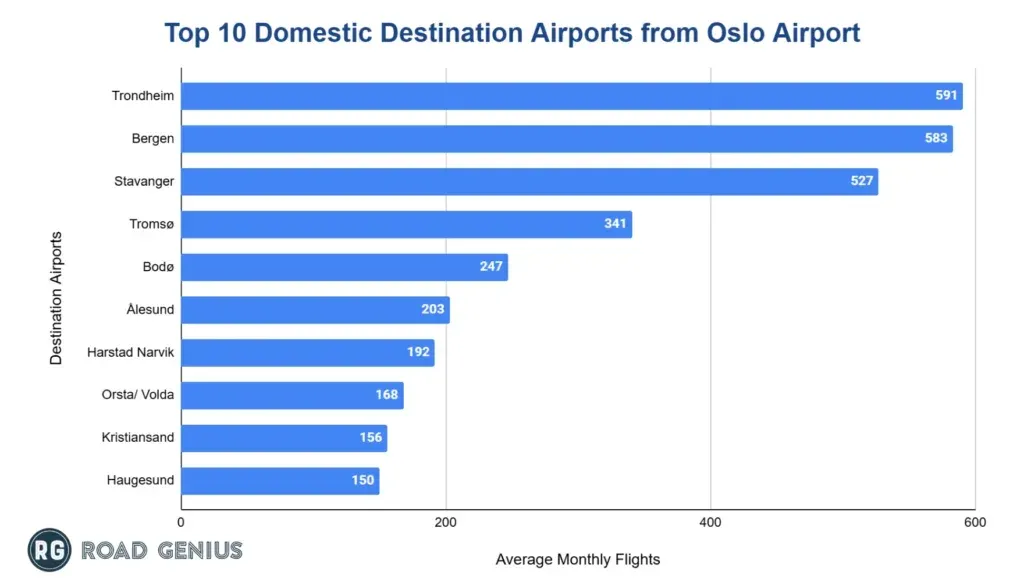
- Trondheim represents the busiest domestic route with 591 flights per month on average, serving as the primary connection to central Norway.
- This is closely followed by Bergen with 583 monthly flights.
- Stavanger and Tromsø followed with 527 and 341 monthly flights, while Bodø completed the top five with 247 flights.
International Destinations
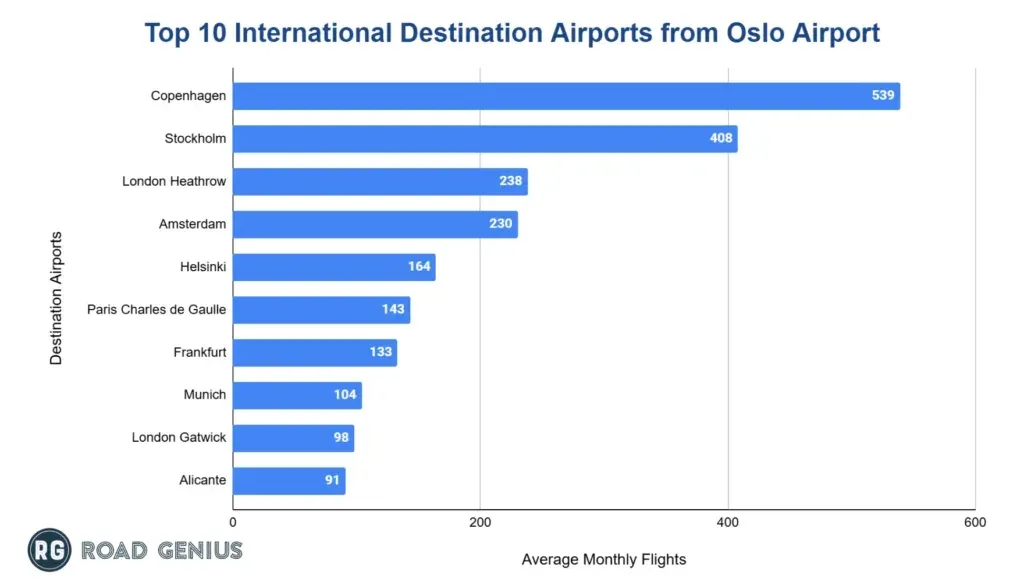
- Copenhagen is the most popular international route, averaging 539 flights per month.
- Stockholm is second with 408 monthly flights.
- London Heathrow ranks third among the international destinations with 238 flights per month.
- Amsterdam and Helsinki round out the top five with 230 and 164 flights per month respectively.
How much cargo does Oslo Airport handle annually?
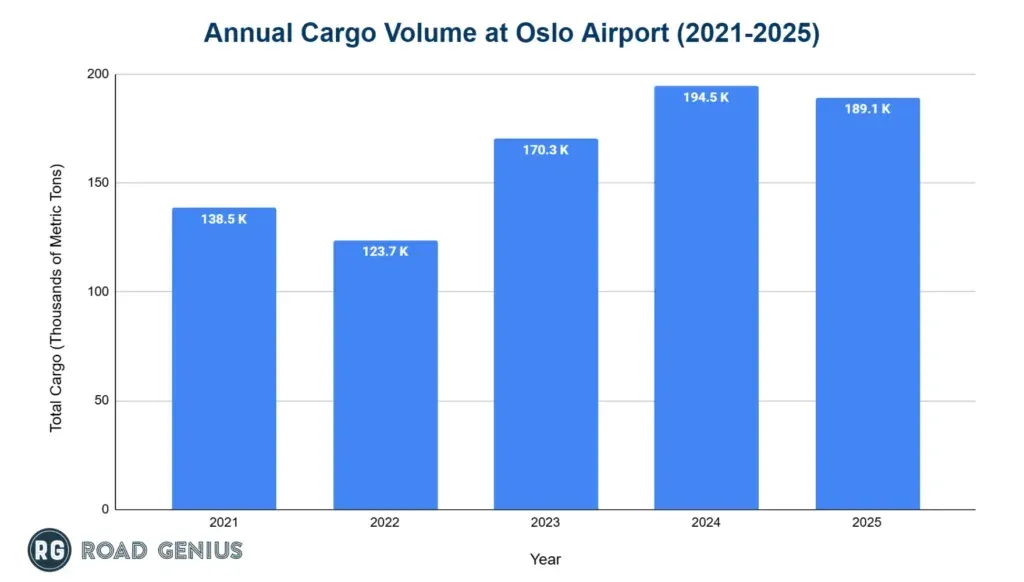
Oslo Airport handles over 150,000 metric tons of cargo each year.
- The airport processed 189,133 metric tons in 2025, a 2.7% decrease from 194,478 metric tons in 2024.
- Despite the pandemic, cargo volume remained steady with 138,498 metric tons in 2021.
- After a temporary decline to 123,651 metric tons in 2022, cargo volume rose to 170,343 metric tons in 2023, continuing upward in 2024.
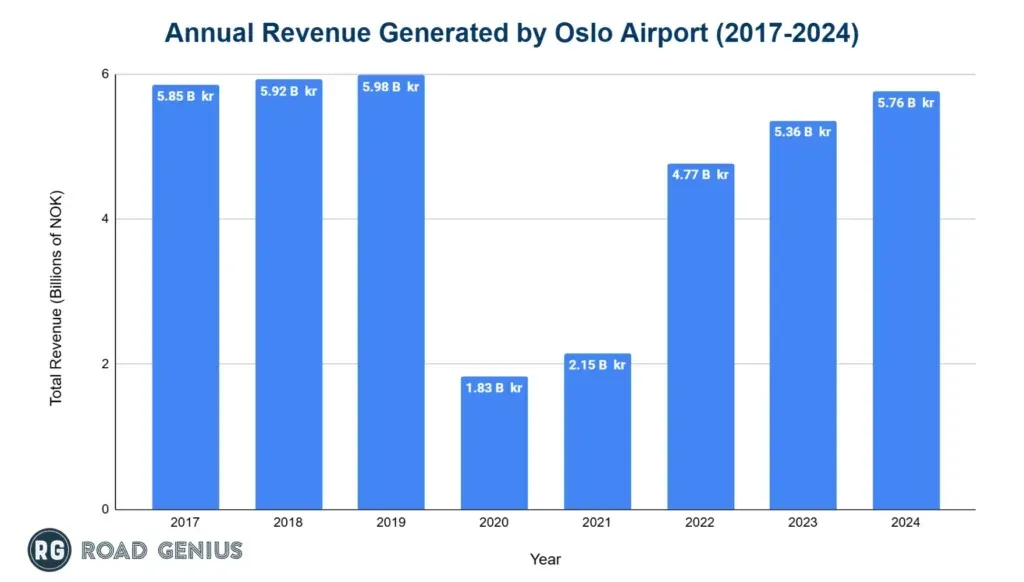
How much revenue has Oslo Airport generated each year?
Oslo Airport generates over NOK 5 billion in operating income annually.
- The airport earned NOK 5.76 billion in 2024, up 7.5% from 2023 and nearing pre-pandemic figures.
- In 2019, revenue was NOK 5.98 billion, which dropped to NOK 1.83 billion in 2020, a 69% decline.
- Recovery progressed with NOK 2.15 billion in 2021, NOK 4.77 billion in 2022 and NOK 5.36 billion in 2023.
More Statistics
- Amsterdam Airport Schiphol (AMS) Statistics
- Vienna Airport Statistics
- Split Airport Statistics
- Copenhagen Airport Statistics
- Quito Airport (UIO) Statistics
- Malta Airport Statistics
- Lisbon Airport Statistics
- Madeira Airport Statistics
- Hamad International Airport (DOH) Statistics
- King Fahd Airport (DMM) Statistics
- Johannesburg OR Tambo Airport Statistics
- Ankara Esenboğa Airport (ESB) Statistics
What are the main causes of flight disruptions at Oslo Airport?
- Winter weather events such as snow, sleet and ice, which require runway closures and de-icing procedures.
- Airline operational issues including crew shortages, maintenance delays and aircraft availability.
- Technical failures in air traffic control, like the April 2024 outage that closed southern Norway’s airspace.
- External disruptions such as European air traffic control strikes impacting transit flights.
- Aircraft delivery delays and engine issues affecting airline capacity and scheduling.
What are some notable incidents at Oslo Airport?
- January 11, 2017: A Cessna 560 Encore operated by Hesnes Air AS briefly lost control after takeoff due to tailplane icing, recovering at 170 feet.
- In the 1990s, the airport faced controversy over allegations that weather data had been falsified during site selection for Gardermoen.
References
- Avinor — Oslo Airport traffic statistics · avinor.no
- FlightConnections — flights from Oslo (OSL) · flightconnections.com
- Norwegian Safety Investigation Authority (NSIA) — Bergen Airport incidents · nsia.no

