

 Popular Countries
 24/7 Support
Updated
Vancouver International Airport (YVR) is Canada’s second-busiest airport and an important trans-Pacific hub. It handles over 26 million passengers annually and connects North America with Asia, Europe and domestic destinations across Canada.
How many passengers pass through Vancouver International Airport each year?
Vancouver International Airport processes over 25 million passengers annually.
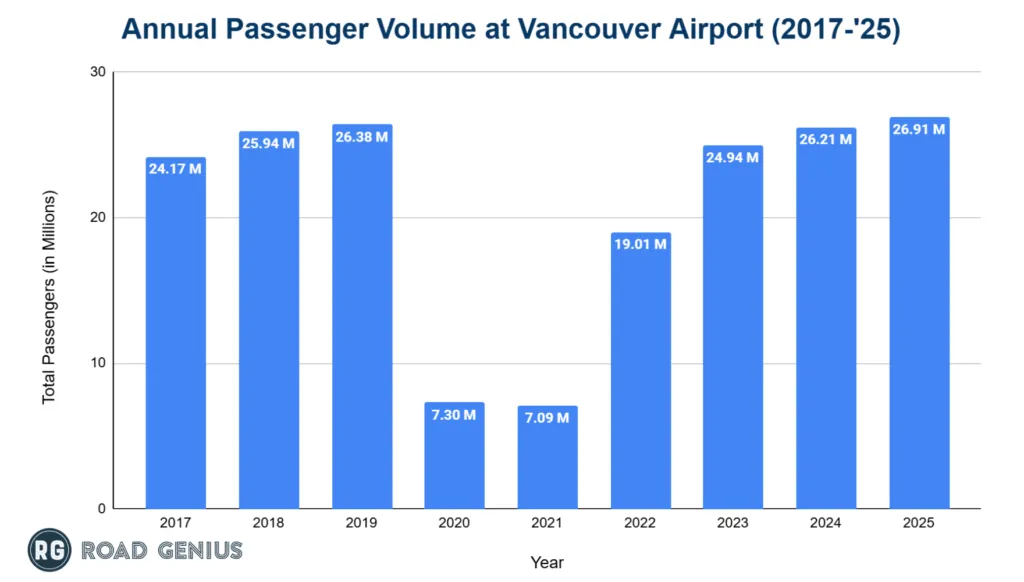
- YVR handled 26.91 million passengers in 2025, a 2.7% increase Year-on-Year (YoY) and reached 102.0% of its 2019 pre-pandemic peak.
- The airport reached a historic high of 26.38 million passengers in 2019 before experiencing a 72.3% decline YoY to 7.30 million in 2020 caused by the pandemic.
- Traffic declined further to 7.09 million in 2021.
- Recovery began in 2022 with 19.01 million passengers (a 168.1% increase YoY), followed by 24.94 million in 2023 (a 31.2% increase YoY), and 26.21 million in 2024 (a 5.1% increase YoY).
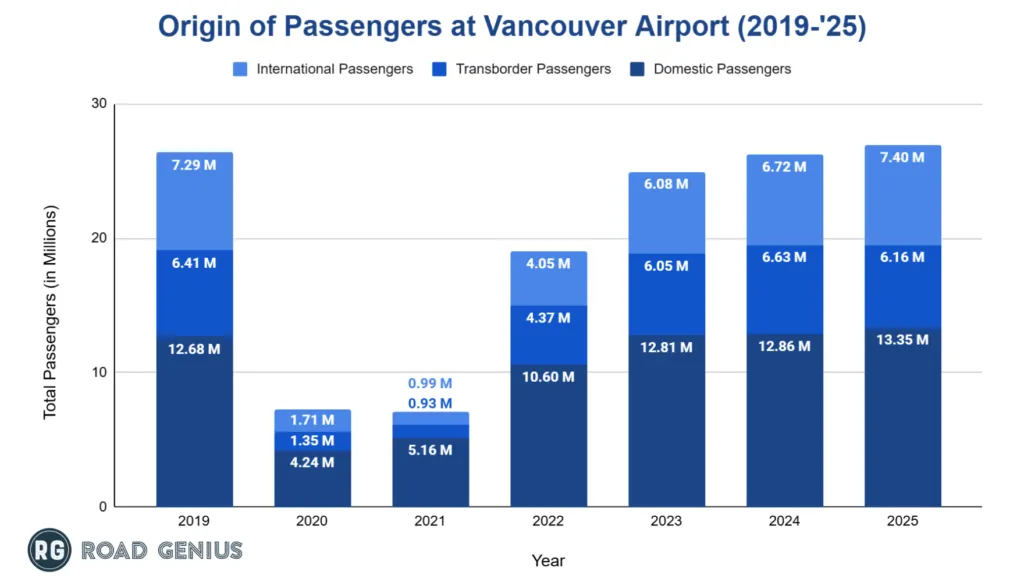
Origin of Passengers at YVR
- Domestic passengers totaled 13.35 million in 2025 (49.6% of total traffic).
- Transborder (U.S.) passengers reached 6.16 million in 2025 (22.9% of traffic).
- Other international passengers numbered7.40 million in 2025 (27.5%).
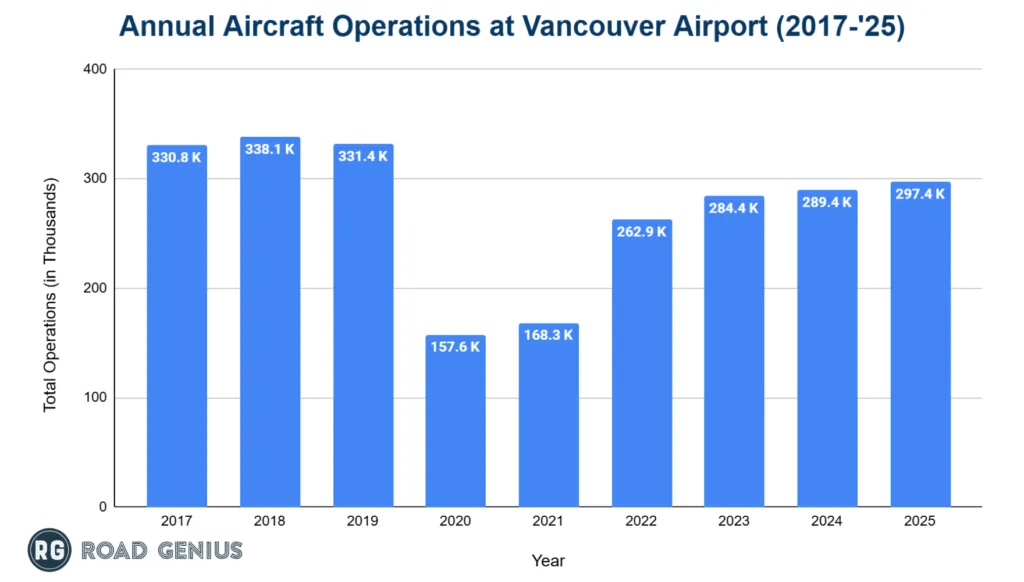
Aircraft Operations at Vancouver International Airport
Vancouver International Airport is still recovering in terms of aircraft operations and in recent years the airport is managing over 280,000 operations annually.
- YVR recorded 297,350 total aircraft movements in 2025, a 2.8% increase from 289,395 movements in 2024.
- Aircraft operations stood at 331,441 in 2019, then fell sharply to 157,563 in 2020 and 168,323 in 2021.
Which airlines operate the most flights out of Vancouver International Airport?
- Air Canada holds around 50% of YVR’s total capacity and is the dominant carrier and primary hub operator
- WestJet serves as the secondary hub airline, though with a much smaller market share
- YVR hosts airlines from a wide range of global regions, including 14 from Asia and three from Oceania
- Major international carriers at YVR include Cathay Pacific, Japan Airlines, Lufthansa and British Airways
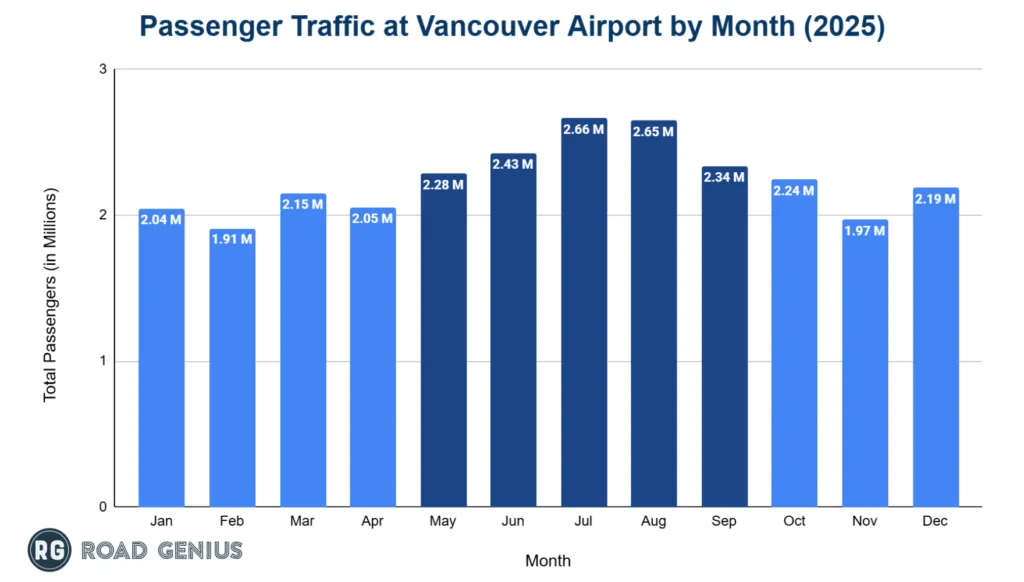
Monthly Trends in Passenger Traffic at Vancouver International Airport
Vancouver Airport (YVR) experiences seasonality; summer months drive peak volumes.
- July and August 2025 were the busiest months, at 2.66 million and 2.65 million passengers respectively; June followed (2.43 million).
- February and November were the least busy months, serving 1.91million and 1.97million passengers.
How many routes does Vancouver International Airport serve?
- As of 2024, YVR offers non-stop service to 120 destinations, served by 51 airlines.
- This reflects a slight change from 2023, which featured 53 airlines and 116 destinations.
- The network spans Canada, the U.S., Asia, Europe, Oceania and Latin America.
- Domestic coverage includes 24 destinations within British Columbia.
- YVR added 13 new routes in 2023 and 10 more in 2024, including direct services to Singapore and Dubai.
Which destinations are the most popular from Vancouver International Airport?
Top Domestic Destinations
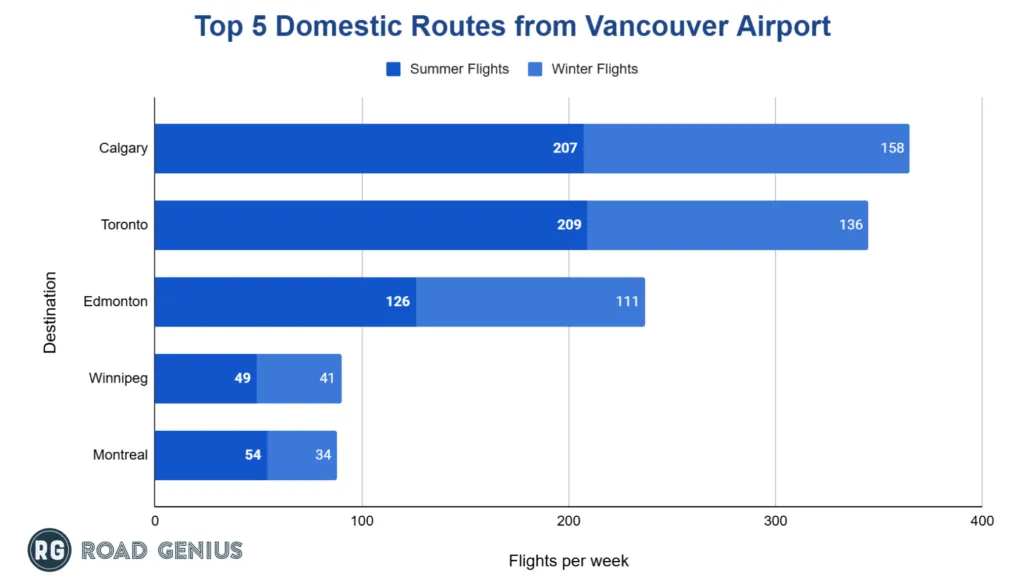
- Toronto (YYZ) leads as the busiest domestic route from YVR, with 209 summer flights and 136 winter flights per week on average in 2024/25.
- Calgary (YYC) and Edmonton (YEG) are also popular, with 207 and 126 flights per week during peak summer, respectively.
- Montreal (YUL) averaged 54 weekly summer flights in 2024.
Top U.S. Destinations
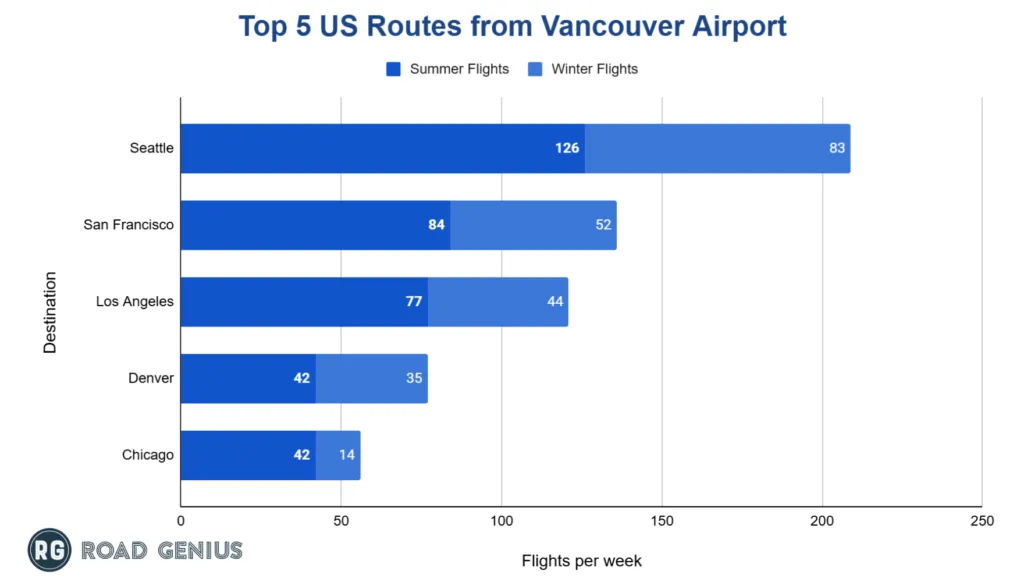
- Seattle (SEA) was the leading U.S. destination by number of flights in 2024/25, with 126 summer flights per week on average.
- San Francisco and Los Angeles followed with 84 and 77 flights per week during peak summer.
Top International Destinations
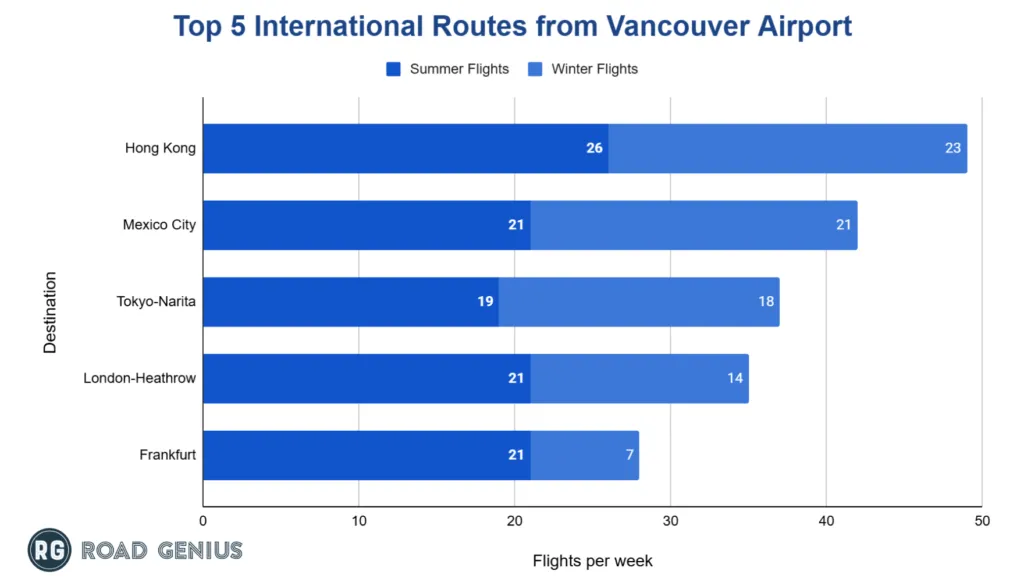
- Hong Kong (HKG) stands as the premier overseas international destination, with 26 flights per week in 2024/25
- London-Heathrow (LHR) and Frankfurt (FRA) followed, each serving 21 summer flights per week.
How much cargo does Vancouver International Airport handle annually?
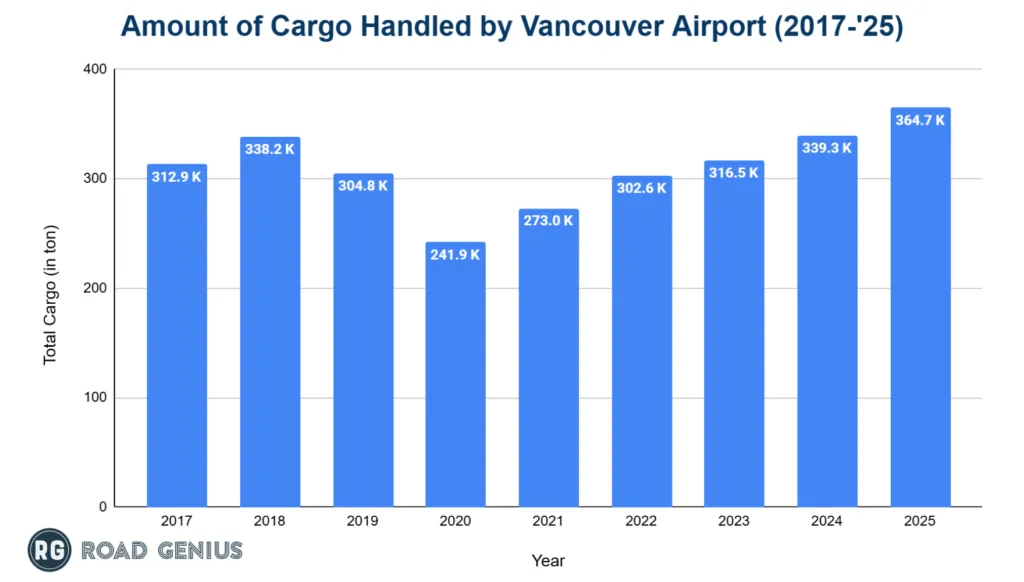
Vancouver International Airport reached record cargo volume in 2025, processing 364,742 tonnes of cargo, a 7.5% increase YoY (339,276 tonnes in 2024)
- This also surpassed the pre-pandemic record of 338,180 tonnes set in 2018.
- Due to the pandemic, cargo volume fell to 241,895 tonnes in 2020.
- Cargo volumes recovered from 273,049 tonnes in 2021 to 302,573 tonnes in 2022 and 316,485 tonnes in 2023.
How much revenue does Vancouver International Airport generate each year?
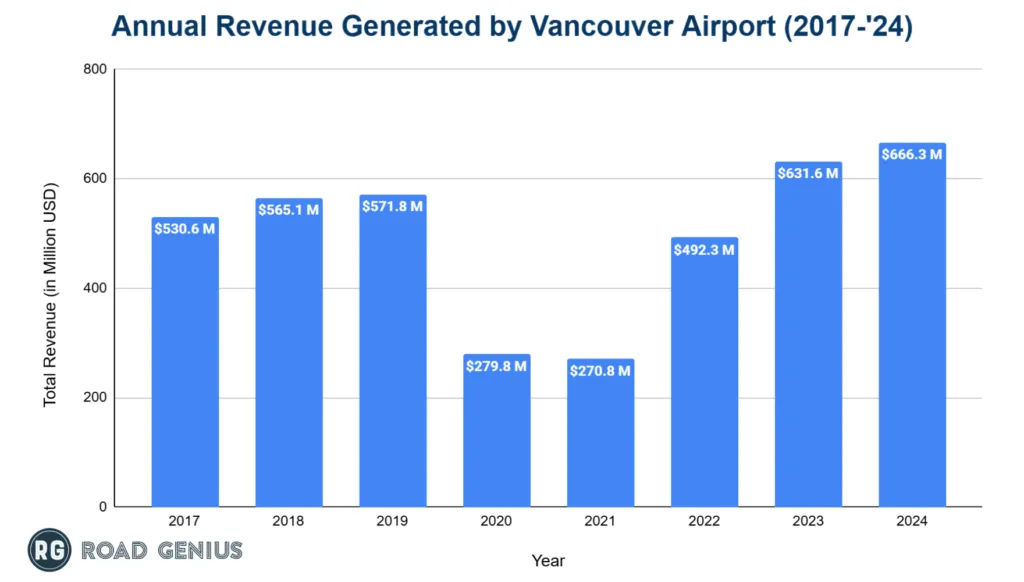
YVR generates over $600 million in annual revenue.
- In 2024, the airport set a new record with $666.3 million, up 4.4% YoY and 20.1% above 2019 levels.
- Revenue in 2019 reached $571.8 million, but fell to $279.8 million in 2020 due to pandemic disruptions.
More Statistics
- Abbotsford Airport Statistics
- Calgary Airport Statistics
- Edmonton International Airport Statistics
- Halifax Airport Statistics
- Hamilton Airport (YHM) Statistics
- Kelowna International Airport Statistics
- Montréal-Trudeau Airport Statistics
- Ottawa Airport (YOW) Statistics
- Prince George Airport Statistics
- Regina Airport Statistics
- Thunder Bay International Airport Statistics
- Toronto Pearson Airport Statistics
Notable Incidents at Vancouver International Airport
- October 14, 2007: Polish immigrant Robert Dziekanski died after being tasered by RCMP at the airport, an action later ruled unjustified by the Braidwood Inquiry
- October 19, 2007: A Piper Seneca en route to Pitt Meadows crashed into a Richmond apartment building, killing the pilot and injuring two residents
- September 18, 2008: An Air Canada A340 collided with an Air Canada Jazz Dash 8 on the runway, damaging both aircraft but causing no injuries
- July 9, 2009: A Piper Navajo from Victoria crashed in a Richmond industrial area, killing both pilots; the flight was transporting blood units for Canadian Blood Services
- October 27, 2011: A Northern Thunderbird Air King Air 100 crashed near Dinsmore Bridge, killing both pilots and injuring passengers and bystanders
- May 9, 2021: A 28-year-old man was fatally shot outside the international terminal in a targeted gang-related attack
- November 19, 2024: An Amazon Air Boeing 767-300F operated by Cargojet overran the runway and sustained substantial damage; no injuries were reported
Vancouver Airport Fast Facts
- Total Airport Area: 1,340 hectares
- The Airport has 2 terminals (Main Terminal and South Terminal)
- The Airport has 3 runways
- Runway 08L/26R: 9,941 ft
- Runway 08R/26L: 12,188 ft
- Runway 13/31: 7,300 ft
- The Airport has 2 helipads
- A: 110 ft
- B: 108 ft
References
- Vancouver Airport Authority (YVR) — Facts and Statistics · yvr.ca
- Aviation Safety Network — Notable Incidents at Calgary Airport · asn.flightsafety.org

