Page last updated: 20 October 2025
Located about 60 kilometers east of downtown Tokyo, Narita International Airport has served as Japan’s primary international gateway since 1978. It handles most long-haul flights linking Asia with the Americas and Europe and also functions as the country’s busiest air-cargo hub.
How many passengers pass through Tokyo Narita Airport each year?
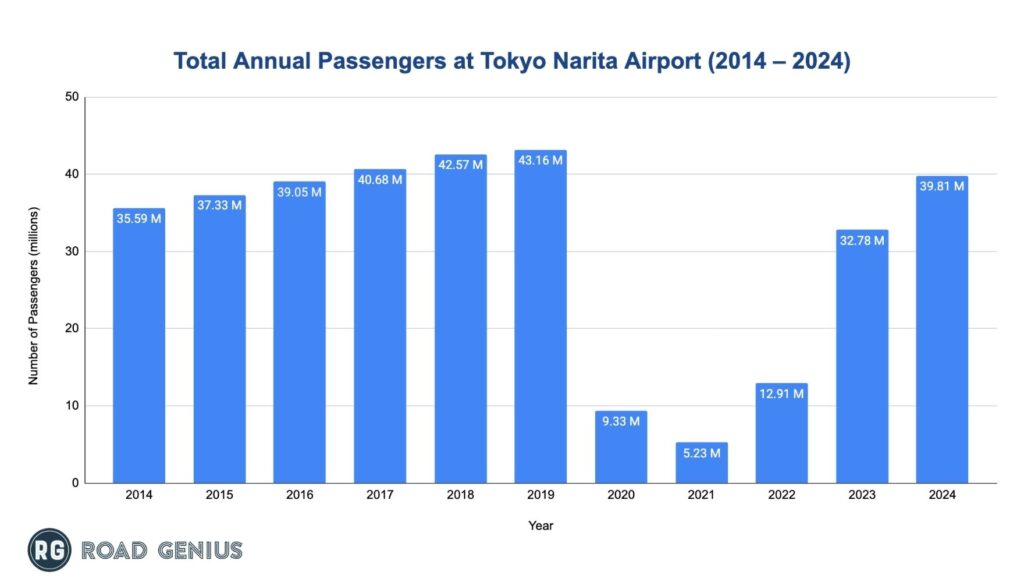
Approximately 40 million passengers travel through Tokyo Narita Airport each year.
- Passenger volume increased from 35.59 million in 2014 to 43.16 million in 2019 before the pandemic upended travel.
- The pandemic triggered a steep decline, with traffic dropping to 9.33 million in 2020 then bottoming out at 5.23 million in 2021.
- In 2024, Narita Airport served 39.81 million passengers, reaching 92% of the 2019 peak
How many aircraft operations occur at Tokyo Narita Airport each year?
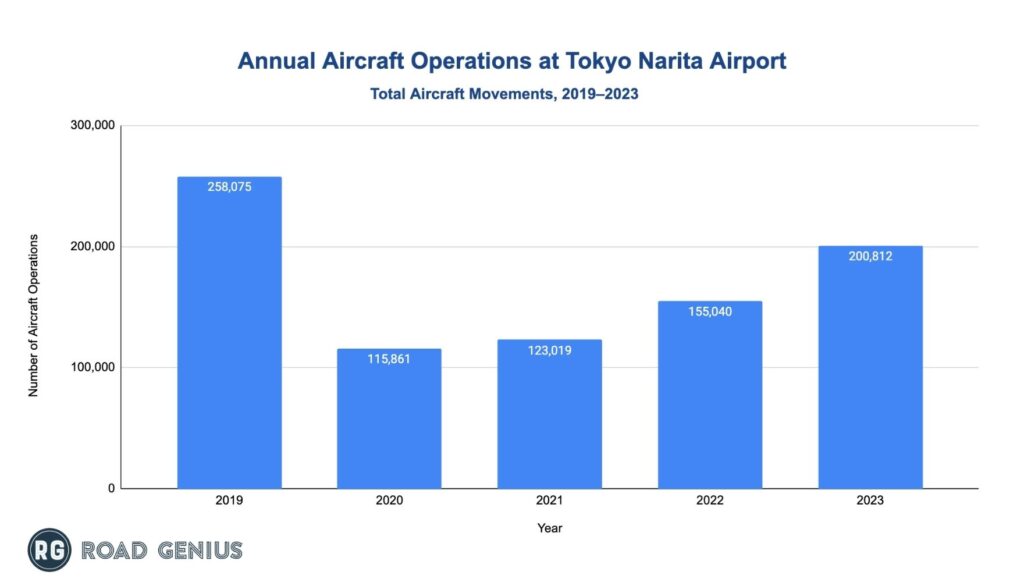
- Before the pandemic the airport managed 258,075 operations in 2019.
- Operations fell to a low of 115,861 in 2020, then recovered to 155,040 in 2022 before reaching 200,812 in 2023.
- In 2023, these operations included 159,612 international flights and 41,200 domestic flights.
- International flights accounted for 79.5% of all movements in 2023
Aircraft Operations by Type
Most NRT operations are passenger flights, followed by significant cargo activity and a small share of other movements.
- Passenger flights accounted for 163,896 operations in 2023 and remained the airport’s largest category.
- Cargo flights totaled 32,878 operations in 2023 highlighting NRT’s status as Japan’s leading air-freight hub.
- Other operations, including ferry flights, technical stops and private aircraft, comprised 4,038 movements in 2023.
- Air taxi, general aviation and military operation categories are not reported separately in NAA’s statistical system unlike US FAA classifications.
| Aircraft Operations by Type at Tokyo Narita Airport | |||||
| Type | 2019 | 2020 | 2021 | 2022 | 2023 |
| Passenger Flights | 224,203 | 74,383 | 74,402 | 112,654 | 163,896 |
| Cargo Flights | 28,944 | 37,330 | 44,792 | 38,624 | 32,878 |
| Other | 4,928 | 4,148 | 3,825 | 3,762 | 4,038 |
Which airlines operate the most flights out of Tokyo Narita Airport?
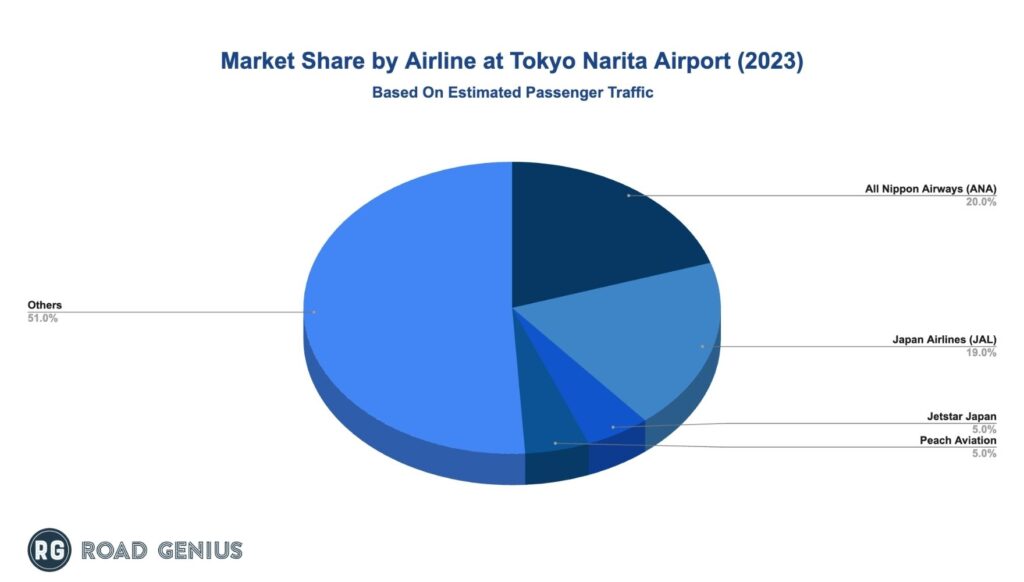
All Nippon Airways (ANA) and Japan Airlines (JAL) dominate passenger traffic at NRT and together carry nearly 40% of all passengers.
- ANA: 20% market share with approximately 6.6 million passengers in 2023.
- JAL: 19% market share with approximately 6.2 million passengers in 2023.
- Jetstar Japan: 5% market share with approximately 1.6 million passengers as the leading low-cost carrier.
- Peach Aviation: 5% market share with approximately 1.6 million passengers in domestic and growing international operations.
- Other international carriers: 51% combined market share including Asian European and American airlines.
What are the most popular destinations from Tokyo Narita Airport?
Narita’s busiest routes link Japan to major Asian cities with short-haul sectors generating the highest passenger volumes.
- Seoul-Incheon (ICN) ranked among the busiest international city pairs globally in 2024 with over 5 million seats.
- Taipei (TPE) maintains strong traffic with approximately 2 million passengers annually.
- Hong Kong (HKG) remains a key financial-hub destination with consistent demand.
- Bangkok (BKK) and Singapore (SIN) complete the top five Asian destinations for both leisure and business travel.
- Domestically Sapporo (CTS) and Fukuoka (FUK) top the route rankings from NRT.
Monthly Trends at Tokyo Narita Airport
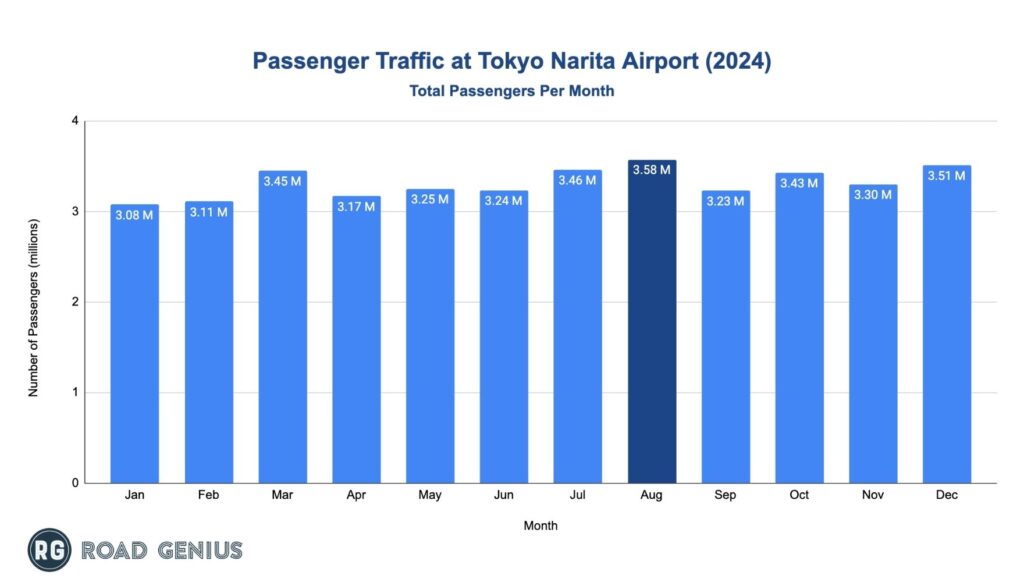
Travel patterns at Narita follow seasonal rhythms, with August leading in 2024 at 3.58 million passengers. December was close behind with 3.51 million.
- Summer is busiest for international travel as July also reached 3.46 million passengers during peak vacation season.
- Spring and autumn bring their own highs, with March and October both topping 3.40 million passengers.
- January is the lull at 3.08 million passengers reflecting the post-holiday slowdown.
Tokyo Travel Resources
How much cargo moves through Tokyo Narita Airport each year
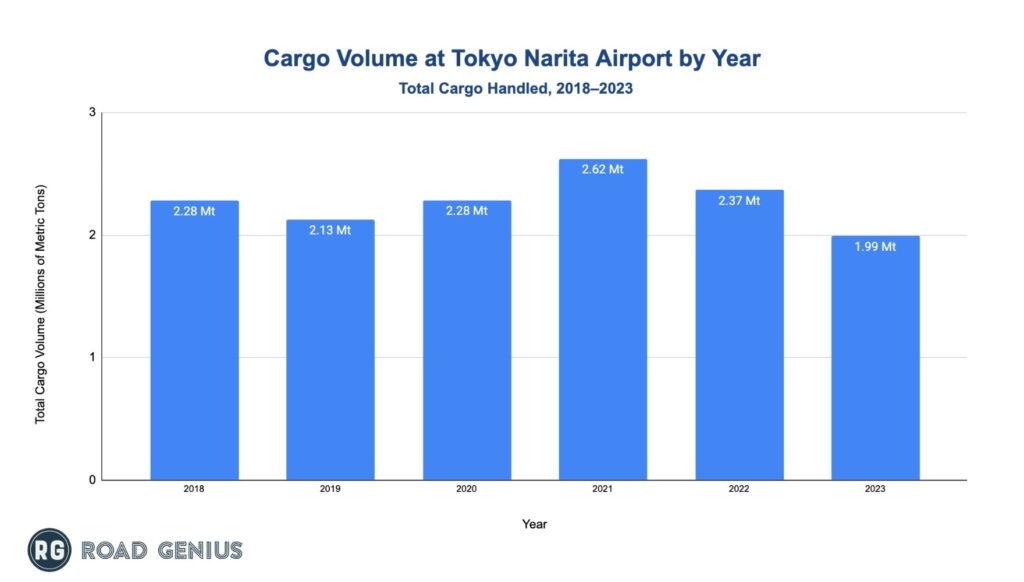
Narita typically handles 1.9 to 2.6 million metric tons of cargo each year placing the airport among the world’s top 10 to 12 cargo hubs.
- The airport processed 1.99 million metric tons of cargo in 2023, with 1.90 million metric tons being international freight.
- Cargo volumes peaked during the pandemic at 2.62 million metric tons in 2021 thanks to surging e-commerce and medical-supply demand.
- Pre-pandemic levels included 2.13 million metric tons in 2019 and 2.28 million metric tons in 2018.
- Narita ranked 9th worldwide for cargo traffic in 2023 according to ACI World.
- International cargo has accounted for over 95% of total freight in recent years, underscoring NRT’s global reach.
How much revenue does Tokyo Narita Airport generate each year?
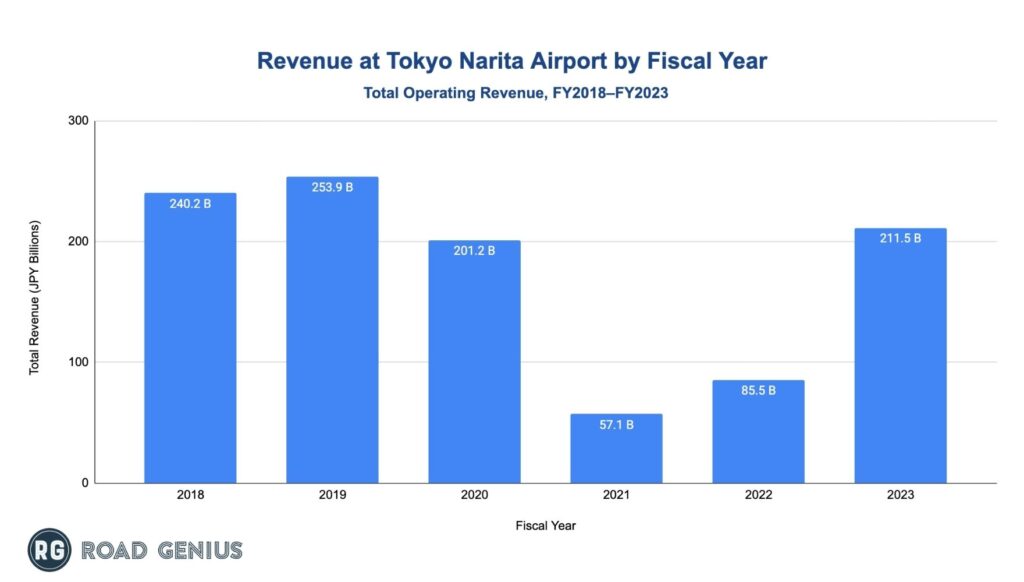
NRT generates more than ¥200 billion in yearly revenue from aeronautical and non-aeronautical sources.
- Total revenue rebounded to ¥211.5 billion in fiscal 2023 marking a strong return to profitability.
- Revenue peaked at ¥253.9 billion in fiscal 2019 before sliding to ¥57.1 billion in fiscal 2021.
- Aeronautical revenue reached ¥95.4 billion while non-aeronautical revenue hit ¥116.1 billion in fiscal 2023.
- The 2023 results show significant progress from ¥85.5 billion in 2022.
How reliable is Tokyo Narita Airport?
NRT maintains strong punctuality standards, with hub airlines ranking among the world’s most reliable carriers.
- ANA finished 7th worldwide in 2023 with an 82.75% on-time rate (Cirium).
- JAL ranked 2nd in Asia-Pacific at 84.47% on-time performance in 2023.
- The airport generally posts 80-83% on-time departures and cancellation rates below 1%.
- In 2019, Narita achieved 79.7% on-time departures with only 0.5% cancellations.
How does Tokyo Narita Airport rank globally?
- Passenger counts placed Narita 59th worldwide in 2023 though it remains in the top 10 for international passenger traffic (ACI World).
- Within Japan NRT ranks 2nd for total passengers; Haneda leads overall while Narita leads in international volume.
- Physical size matters too, the airport’s 1,111 hectares make it one of Asia’s most expansive facilities.
- For long-haul connectivity especially to the Americas and Europe NRT is still Japan’s primary hub.
What expansion projects are underway at Tokyo Narita Airport?
- The “One Terminal” concept will streamline passenger transfers and boost operational efficiency.
- Runway B extension and new Runway C construction form part of an investment plan worth ¥500 to ¥670 billion with completion aimed for 2029.
- Cargo-area development continues in phases to keep NRT competitive as a freight hub.
- The New Mid-Term Management Plan (fiscal 2023-2025) focuses on traffic recovery and operational upgrades.
What are Tokyo Narita Airport’s environmental goals?
- The airport targets net-zero CO₂ emissions by 2050 and a 50% cut by 2030 for Scope 1 and Scope 2.
- Promoting Sustainable Aviation Fuel (SAF) remains central to reducing aviation emissions.
- Renewable-energy expansion includes more on-site solar power and other clean sources.
- Narita reached Airport Carbon Accreditation Level 4 “Transformation” in 2022, marking measurable progress.
What is Tokyo Narita Airport’s economic impact?
- The airport supports thousands of direct jobs and hundreds of thousands of indirect roles across Greater Tokyo.
- As Japan’s leading international gateway NRT drives business travel and tourism that generate billions in economic activity.
- Cargo operations handling nearly 2 million metric tons each year strengthen Japan’s export economy and global supply chains.
- An infrastructure plan valued at ¥500 to 670 billion will add construction jobs and long-term benefits through 2029.
What is Tokyo Narita Airport’s safety record?
- No major hull-loss or fatal passenger accidents occurred at Narita during 2014-2024 (JTSB).
- The Japan Transport Safety Board investigates all incidents and issues safety recommendations.
- Japanese airports and airlines consistently rank among the world’s most punctual and safety-focused operations.
Other Airport Statistics
- Amsterdam Airport (AMS)
- Bordeaux Airport (BOD)
- Charlotte Douglas International Airport (CLT)
- Copenhagen Airport (CPH)
- Dallas Fort Worth International Airport (DFW)
- Dubai Airport (DXB)
- Frankfurt am Main Airport (FRA)
- George Bush Intercontinental Airport (IAH)
- Hartsfield–Jackson Atlanta International Airport (ATL)
- Heraklion Airport (HER)
- Hong Kong Airport (HKG)
- John F. Kennedy International Airport (JFK)
- LaGuardia Airport (LGA)
- Los Angeles International Airport (LAX)
- London Heathrow Airport (LHR)
- Malaga Airport (AGP)
- Madrid Airport (MAD)
- Miami International Airport (MIA)
- O’Hare International Airport (ORD)
- Orlando International Airport (MCO)
- Paris Charles De Gaulle Airport (CDG)
- San Francisco International Airport (SFO)
- Thessaloniki Airport (SKG)
- Vancouver Airport (YVR)
Asia Travel Statistics Resources
- China Statistics
- Dubai Statistics
- Hong Kong Statistics
- India Statistics
- Indonesia Statistics (incl. Bali)
- Israel Statistics
- Japan Statistics (incl. Hokkaido, Okinawa, Osaka, Tokyo)
- Malaysia Statistics
- Saudi Arabia Statistics
- Singapore Statistics
- South Korea Statistics
- Sri Lanka Statistics
- Thailand Statistics (incl. Bangkok)
- Turkey Statistics
