

 Popular Countries
 24/7 Support
Updated
King Shaka International Airport (KSIA) serves as the main aviation gateway to KwaZulu-Natal province and Durban, South Africa’s third-largest city. The airport plays a key role in domestic travel and regional connections while also functioning as an international access point to the Indian Ocean coastline.
How many passengers pass through King Shaka International Airport each year?
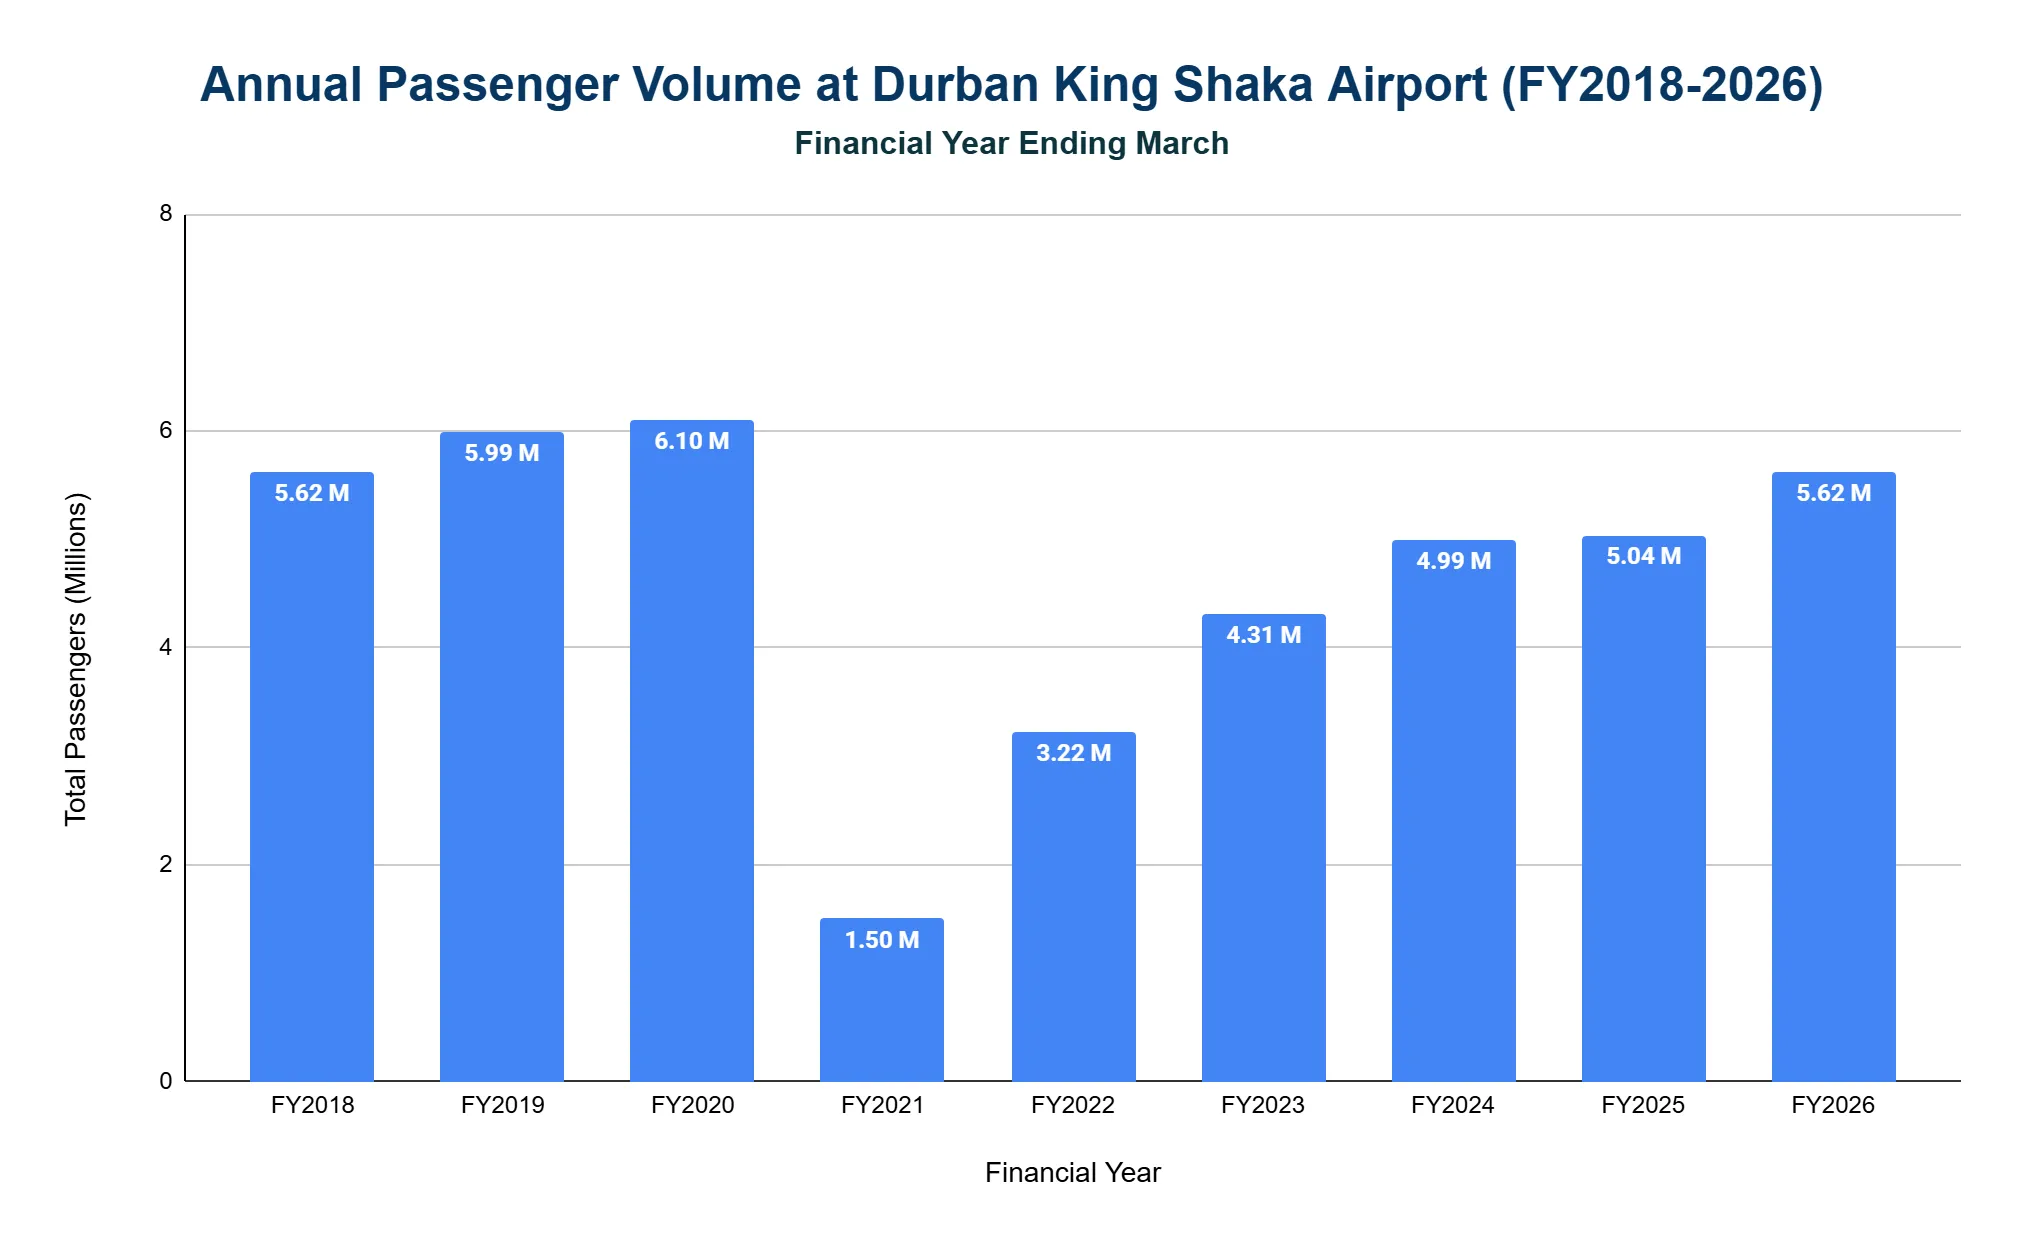
King Shaka International Airport processes over 5 million passengers each year, showing steady recovery from the pandemic and retaining its position as South Africa’s third-busiest airport.
- KSIA handled 5.62 million passengers in the year ending March 2026 (FY2026), which is a 92% recovery compared to pre-pandemic levels.
- The airport had reached 6.10 million passengers in FY2020 before COVID-19 significantly reduced operations.
- Passenger numbers dropped sharply to 1.50 million in FY2021, one of the steepest declines among South African airports during the pandemic.
- Recovery gained momentum with 3.22 million passengers in FY2022, followed by 4.31 million in FY2023, 4.99 million in FY2024, and 5.04 million in FY2025, leading to the current levels.
Types of Passengers
King Shaka International Airport has a heavily domestic passenger base, with over 94% of travelers on domestic routes. This reflects its role as a regional hub in South Africa’s aviation network.
- Domestic passengers totaled 5.31 million in the year ending March 2026 (FY2026), representing 94.5% of total traffic.
- International passengers reached 296,387 in FY2026, accounting for 5.3% of total traffic.
- Regional passenger traffic accounted for 6,217, while unscheduled passenger traffic totaled 7,624.
| Passenger Traffic Types at King Shaka Airport (FY2020-2026) | ||||
|---|---|---|---|---|
| Year | International Passengers | Regional Passengers | Domestic Passengers | Unscheduled Passengers |
| FY2020 | 380,871 | 12,438 | 5,699,080 | 7,239 |
| FY2021 | 21,829 | 0 | 1,475,230 | 5,227 |
| FY2022 | 60,273 | 0 | 3,147,204 | 8,448 |
| FY2023 | 232,077 | 0 | 4,066,174 | 9,168 |
| FY2024 | 274,882 | 2,514 | 4,706,511 | 10,271 |
| FY2025 | 319,043 | 5,876 | 4,710,158 | 7,845 |
| FY2026 | 296,387 | 6,217 | 5,305,971 | 7,624 |
What is the total number of aircraft operations at King Shaka International Airport each year?
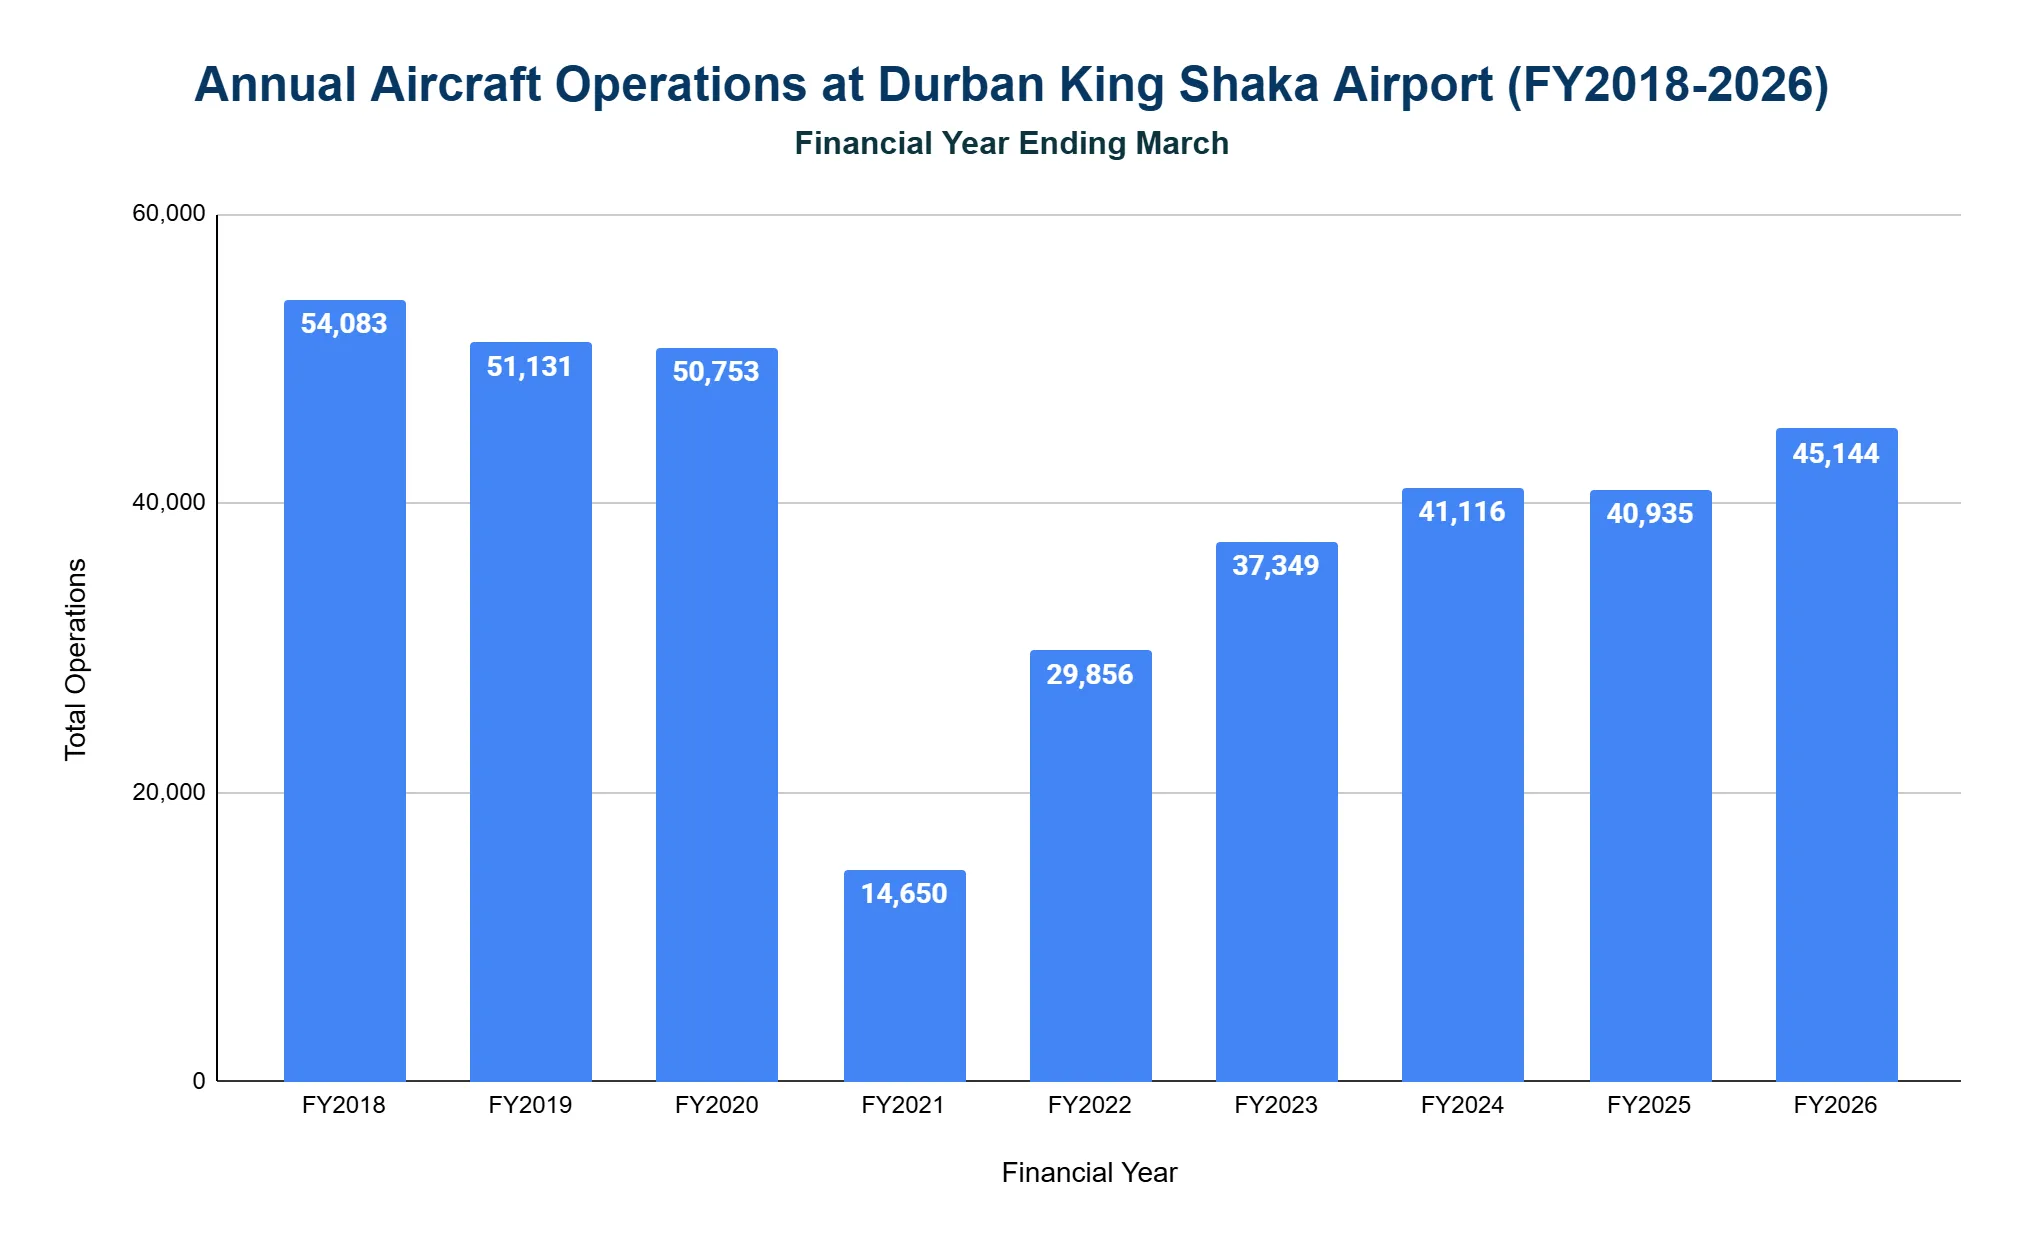
King Shaka International Airport records over 40,000 total aircraft operations annually, with flight movements showing steady recovery in line with passenger trends.
- There were 45,144 aircraft movements in FY2026, an 89% recovery compared to pre-pandemic levels.
- The airport recorded 50,753 movements in FY2020 before dropping sharply due to COVID-19.
- Aircraft operations fell dramatically to 14,650 in FY2021, representing the lowest level in decades due to COVID-19 restrictions
- Recovery accelerated with 29,856 movements in FY2022 and 37,349 movements in FY2023, followed by 41,116 movements in FY2024 and then a slight dip to 40,935 movements in FY2025, showing overall progress back toward pre-pandemic operational levels.
Types of Aircraft Operations
Flight operations at King Shaka International largely reflect passenger trends, with domestic flights dominating the schedule.
- In FY2026, domestic aircraft movements accounted for 40,178 operations, comprising 89% of total aircraft activities.
- International aircraft movements constituted 5.3% of total operations, totaling 2,396 movements.
- 2,267 unscheduled aircraft movements were recorded that year.
- Regional aircraft movements totaled only 303.
| Aircraft Movement Types at King Shaka Airport (FY2020-2026) | ||||
|---|---|---|---|---|
| Year | International Operations | Regional Operations | Domestic Operations | Unscheduled Operations |
| FY2020 | 2,495 | 650 | 43,466 | 4,142 |
| FY2021 | 233 | 0 | 11,505 | 2,912 |
| FY2022 | 663 | 0 | 25,406 | 3,787 |
| FY2023 | 1,580 | 0 | 32,673 | 3,096 |
| FY2024 | 2,148 | 242 | 35,921 | 2,805 |
| FY2025 | 2,515 | 306 | 35,874 | 2,240 |
| FY2026 | 2,396 | 303 | 40,178 | 2,267 |
Which airlines operate the most flights out of King Shaka International Airport?
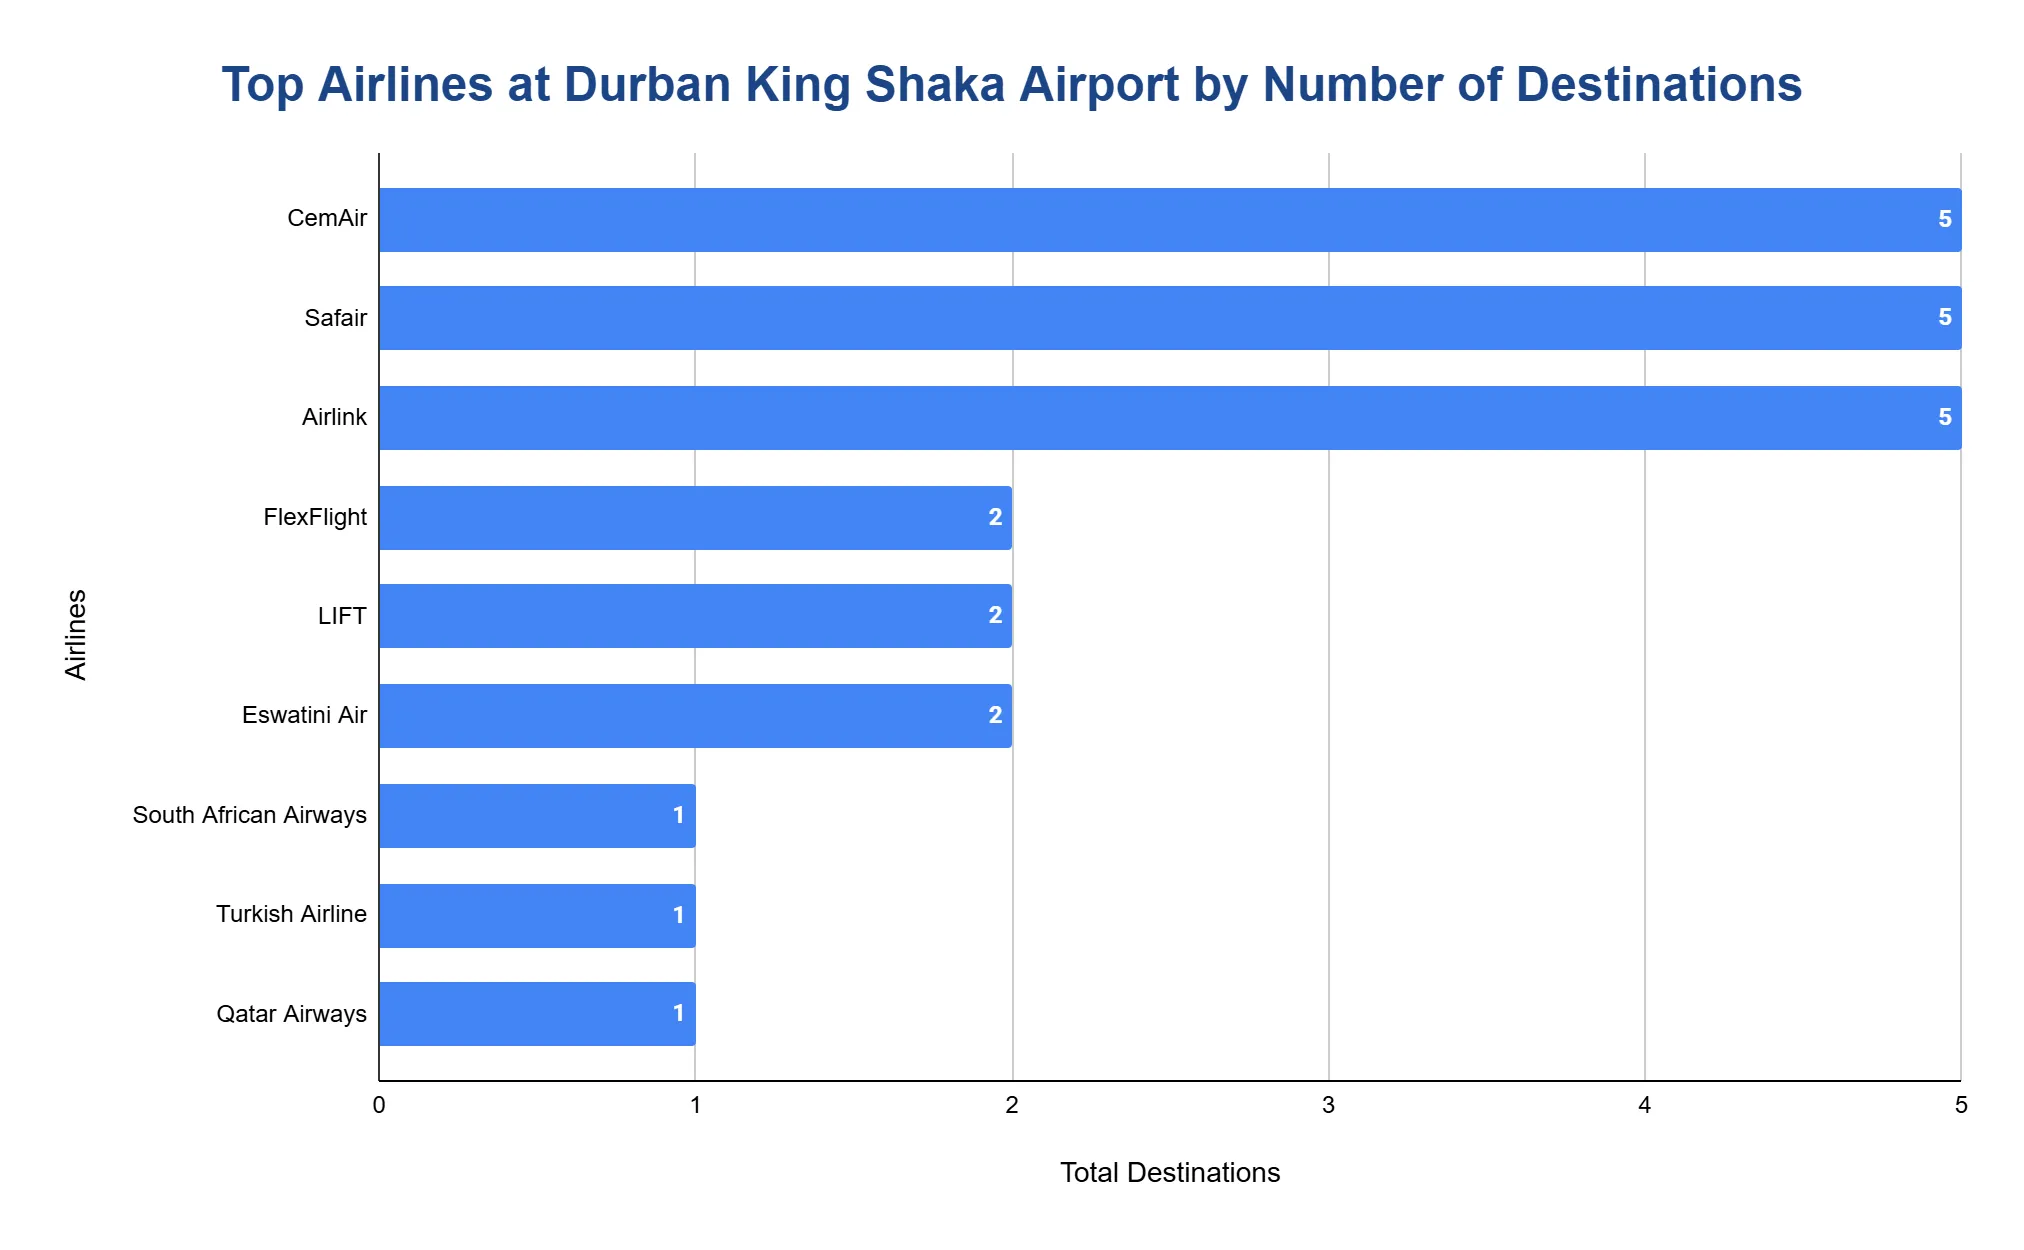
The airline mix at King Shaka includes domestic low-cost carriers and full-service airlines, along with a few key international routes.
- CemAir, Safair and Airlink each serve 5 destinations.
- FlexFlight, LIFT and Eswatini Air operate to 2 destinations each.
What are the monthly trends in passenger traffic at King Shaka International Airport?
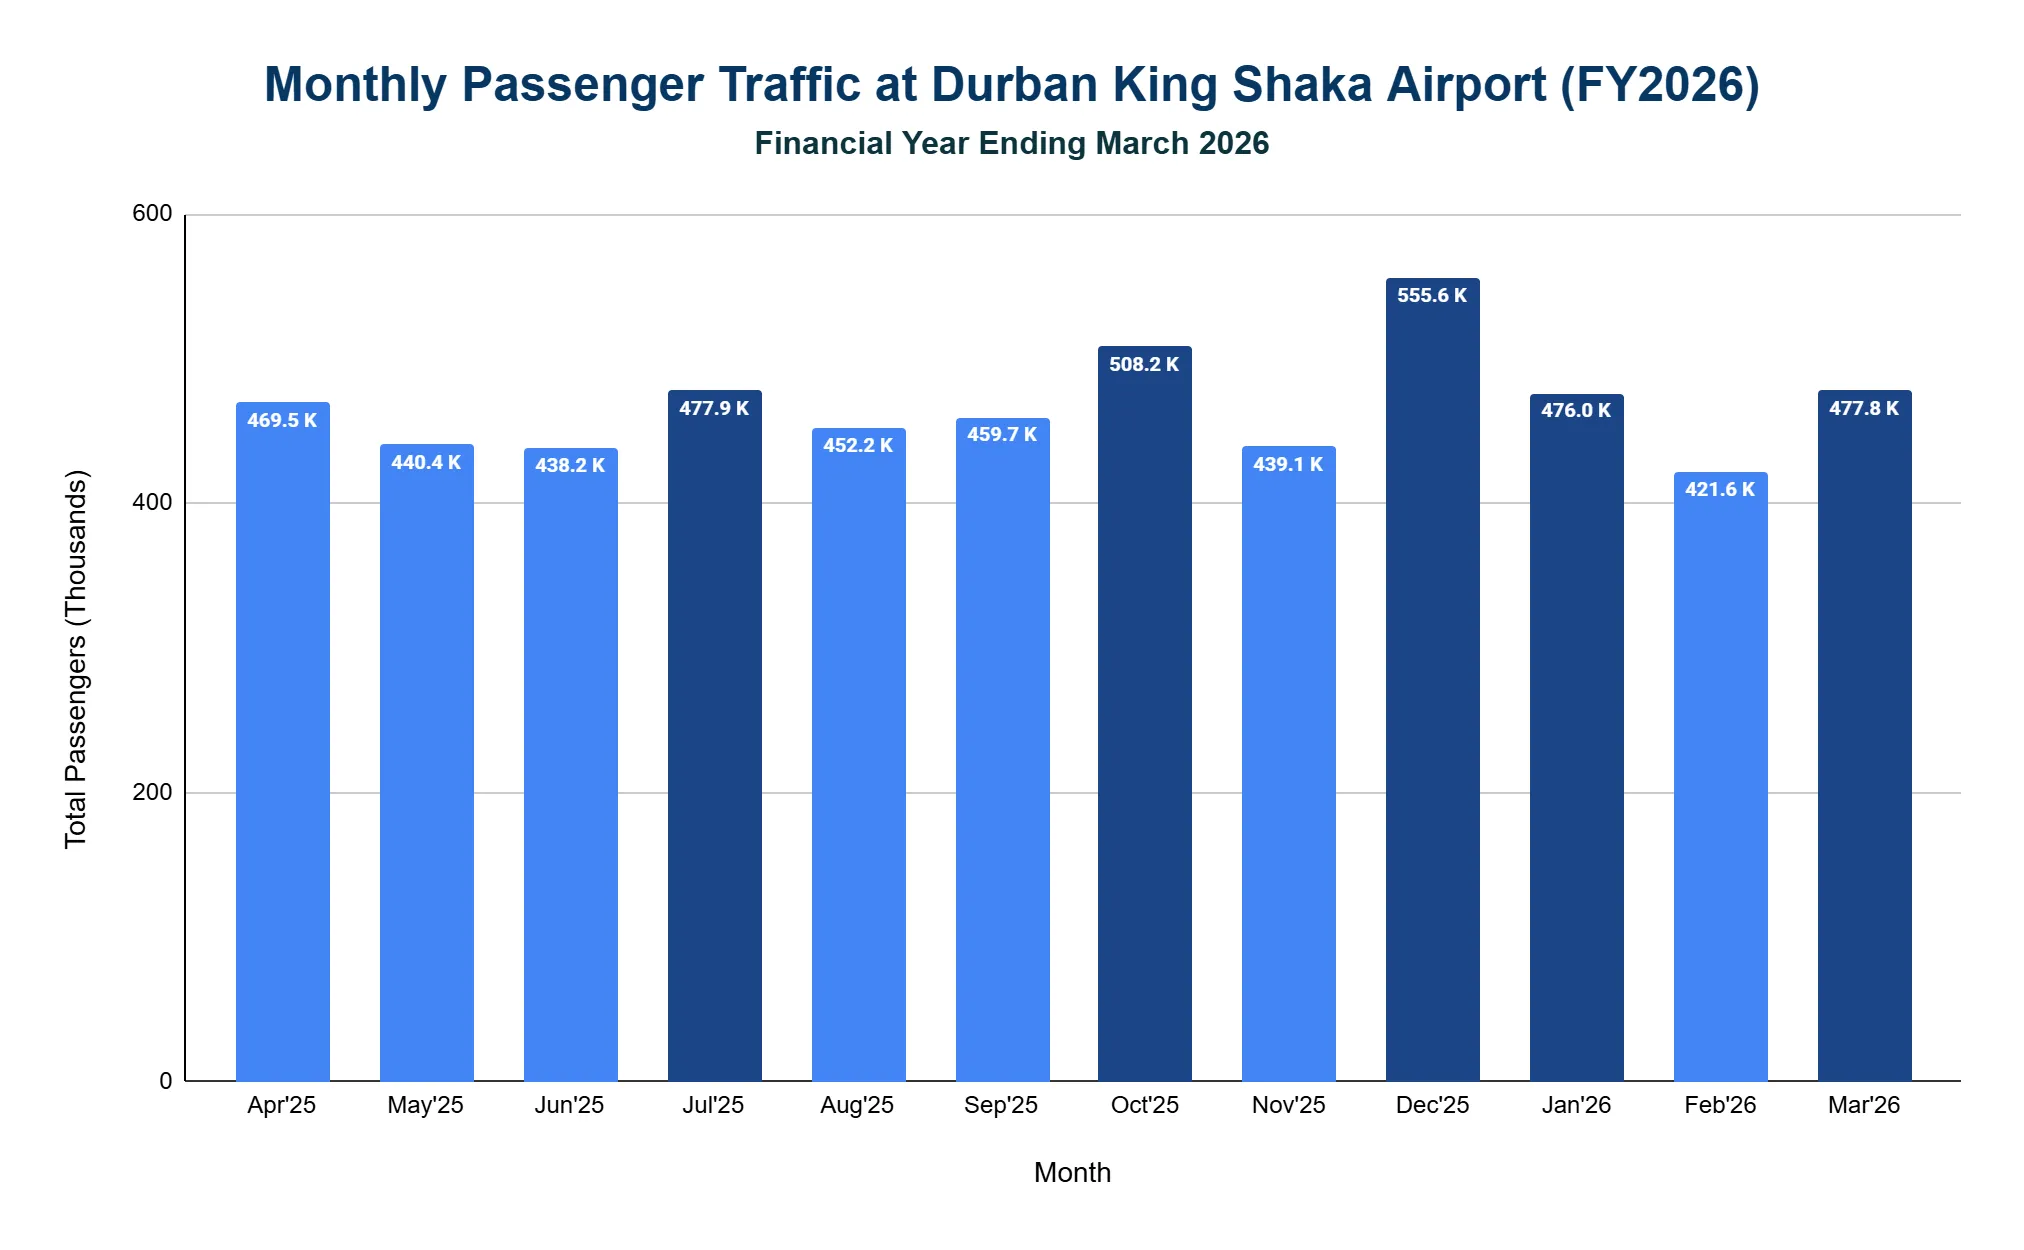
Passenger volumes at Durban King Shaka Airport remain fairly consistent throughout the year, with notable seasonal peaks.
- December 2025 represented the peak travel month in FY2026, with 555,560 passengers.
- This was followed by October 2025 with 508,206 passengers.
- January 2026, March 2026 and July 2025 also crossed the 470,000 threshold with these months handling 475,978, 477,778 and 477,937 passengers, respectively.
- In FY2026, June 2025 and February 2026 were the least busy months with 438,235 and 421,627 passengers, respectively.
How many routes are there at King Shaka International Airport?
- 13 direct domestic routes serve major cities and regional centers in South Africa.
- Around 8 international routes connect to cities in the Middle East and Africa.
- The core network includes 21 direct routes serving business and leisure travel year-round.
- Seasonal charter flights add routes during peak periods.
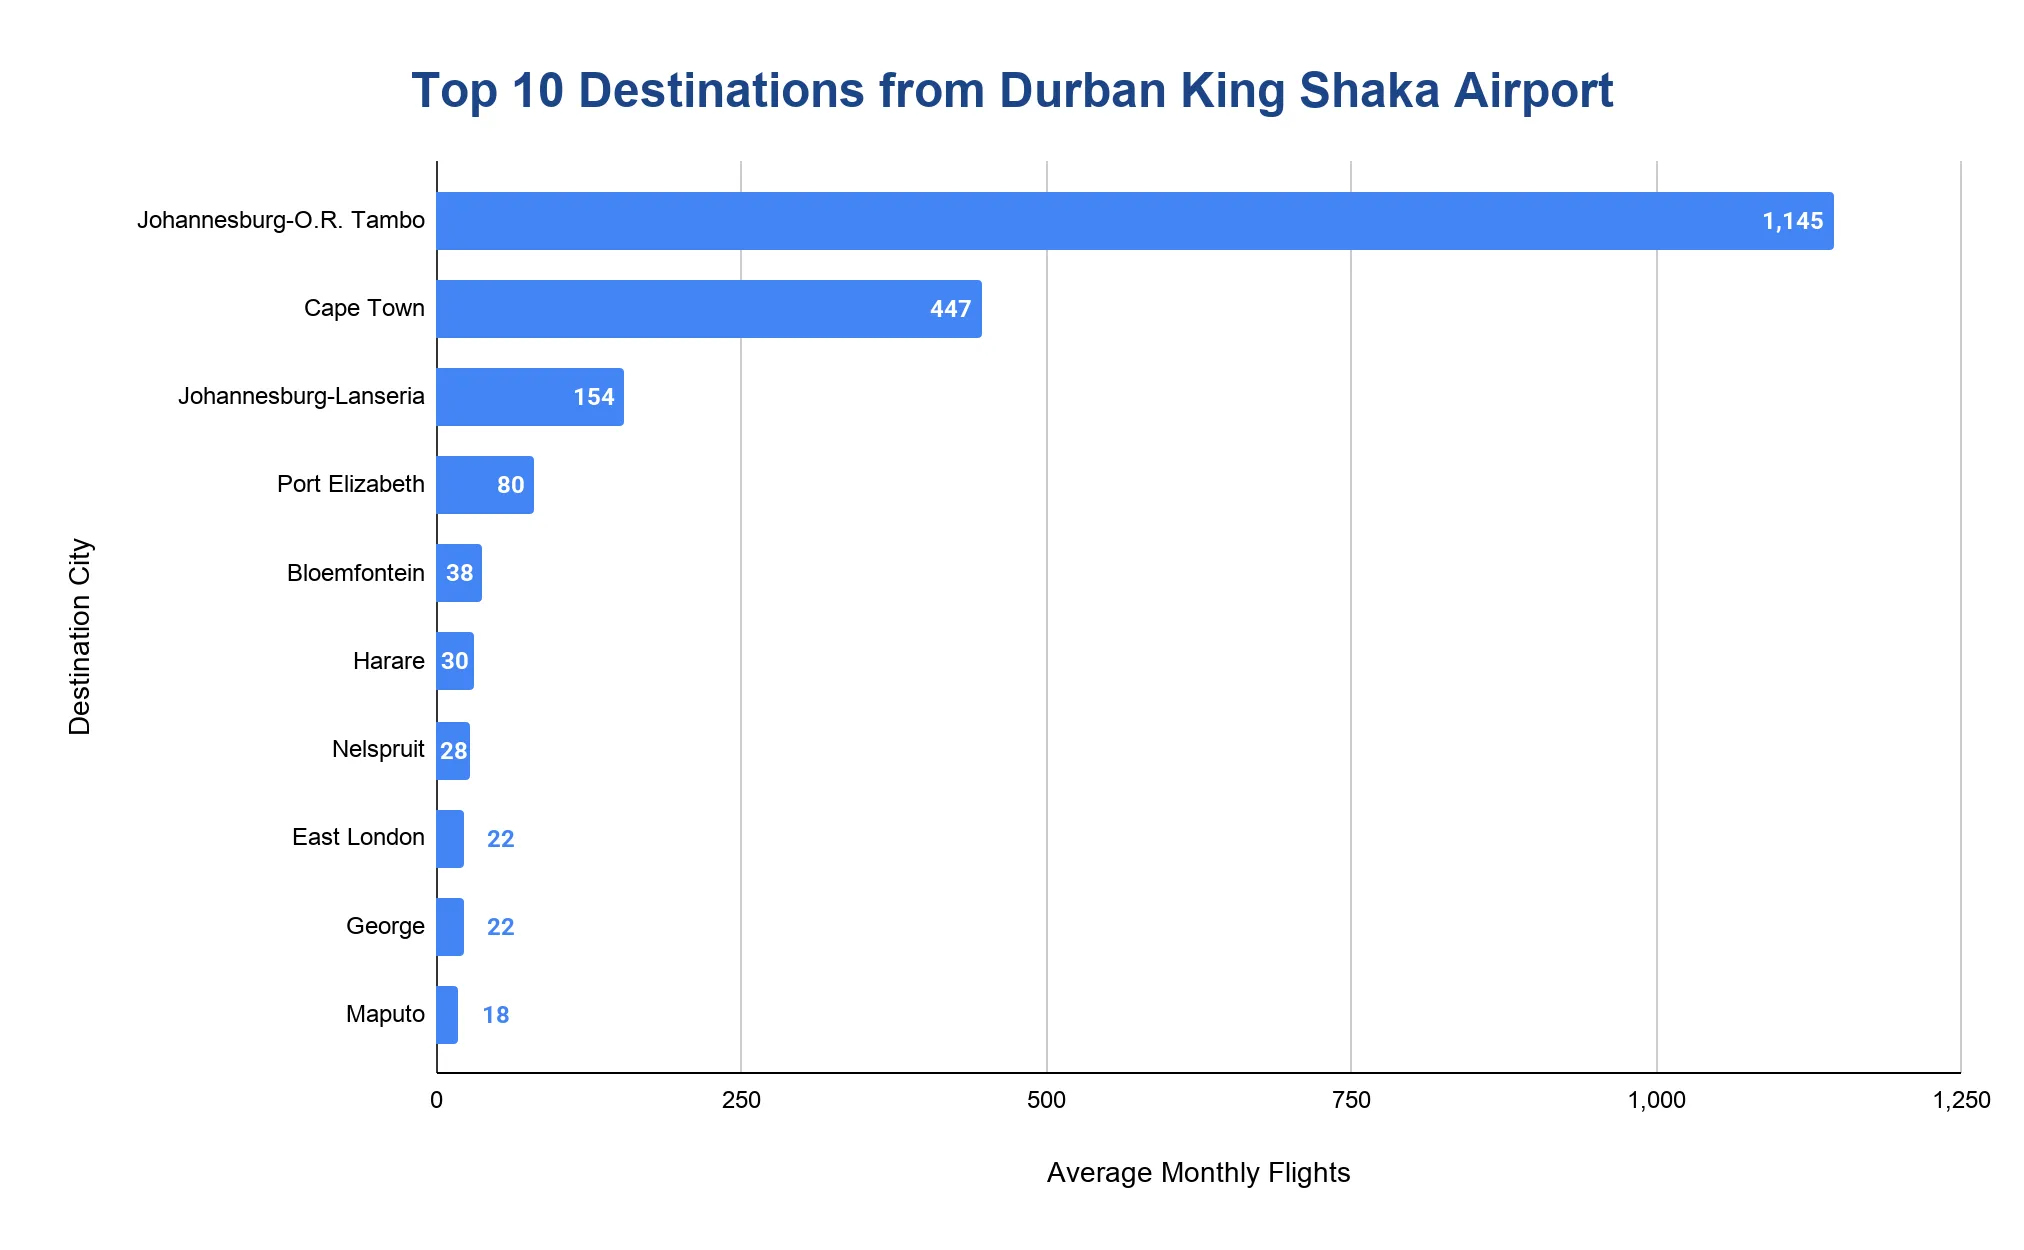
Which destinations are the most popular from King Shaka International Airport?
- Johannesburg (O.R. Tambo) receives 1,145 flights per month, making it the busiest domestic route by far.
- Cape Town follows with 447 flights per month, providing crucial connectivity to the legislative capital.
- Johannesburg (Lanseria) operates 154 flights per month, offering alternative access to the economic hub.
- Gqeberha (Port Elizabeth) receives 80 flights per month, serving the Eastern Cape's primary city.
- Bloemfontein completes the top 5 with 38 flights per month.
What are the main causes of flight disruptions at King Shaka International Airport?
- Airline-related issues like crew shortages, aircraft malfunctions and logistical delays.
- Technical or mechanical aircraft issues that lead to groundings or cancellations.
- Air traffic congestion on busy domestic routes, especially to Johannesburg and Cape Town.
- Weather-related disruptions, though less common than at other airports.
- Delays at major hubs that cause ripple effects for connecting flights.
Related Statistics
- Amsterdam Airport Schiphol (AMS) Statistics
- Vienna Airport Statistics
- Bahrain International Airport (BAH) Statistics
- Helsinki Airport Statistics
- Oslo Airport Statistics
- Lisbon Airport Statistics
- Madeira Airport Statistics
- Porto Airport Statistics
- Seoul Gimpo Airport Statistics
- Ankara Esenboğa Airport (ESB) Statistics
- Istanbul Airport (IST) Statistics
- Da Nang Airport Statistics
How much revenue has King Shaka International Airport generated each year?
Financial data for King Shaka International Airport is not reported separately from its parent company, Airports Company South Africa (ACSA), which operates nine airports across the country.
- The ACSA group generated R7.89 billion in revenue in FY2025.
- The group reported R1.13 billion net profit in that financial year.
Note: Financial statements for FY 2026 have not been released yet.
What are the notable incidents at King Shaka International Airport?
- 13 August 2009: A Yakovlev Yak-18T (ZU-BHR) made an emergency landing on the unfinished runway due to fuel contamination. It was the first aircraft to land at KSIA.
- 5 August 2012: A 1time Airlines MD-83 (ZS-OPZ) had a right-engine failure after takeoff. It returned safely, but debris closed the runway for 3 hours.
- 29 August 2016: A Qatar Airways Boeing 787-8 (A7-BDB) struck a bird on approach and landed safely. The aircraft was grounded for 31 hours.
References
- ACSA — Johannesburg OR Tambo Airport traffic data · airports.co.za
- Airlines and Popular Destinations from Durban Airport · flightconnections.com
- The Aviation Herald — incidents at Johannesburg OR Tambo Airport · avherald.com
- Jacaranda FM — ACSA reports R11bn profit (2024/25) · jacarandafm.com

