Page last updated: 7 August 2025
Hartsfield‑Jackson Atlanta International Airport (ATL) remains the world’s busiest airport by passenger volume, processing more than 100 million travelers each year. Located in Atlanta, Georgia, the airport is a major hub for domestic and international traffic in the southeastern United States.
How many passengers passed through Hartsfield-Jackson Atlanta International Airport each year?
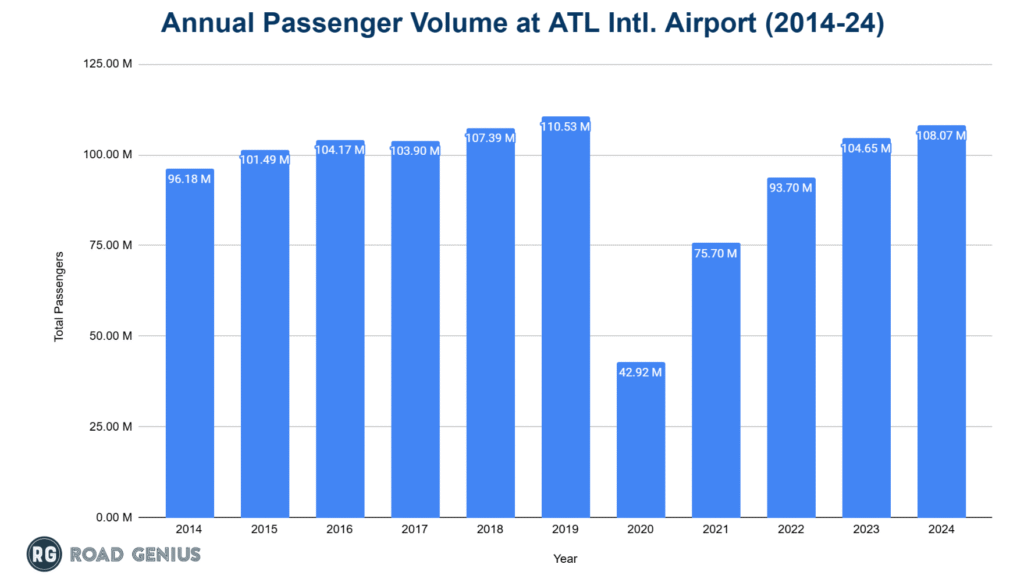
Hartsfield-Jackson Atlanta International Airport (ATL) consistently handles over 100 million passengers annually, maintaining its position as the world’s busiest airport by passenger volume.
- ATL handled 108.07 million passengers in 2024, a 3.3% increase from 2023 and the second‑highest total on record.
- The airport set its all‑time high of 110.53 million passengers in 2019, before the COVID‑19 pandemic led to a temporary decline to 42.92 million in 2020.
- Traffic has since rebounded, rising to 75.7 million in 2021, 93.7 million in 2022, and 104.65 million in 2023.
International vs Domestic Passengers
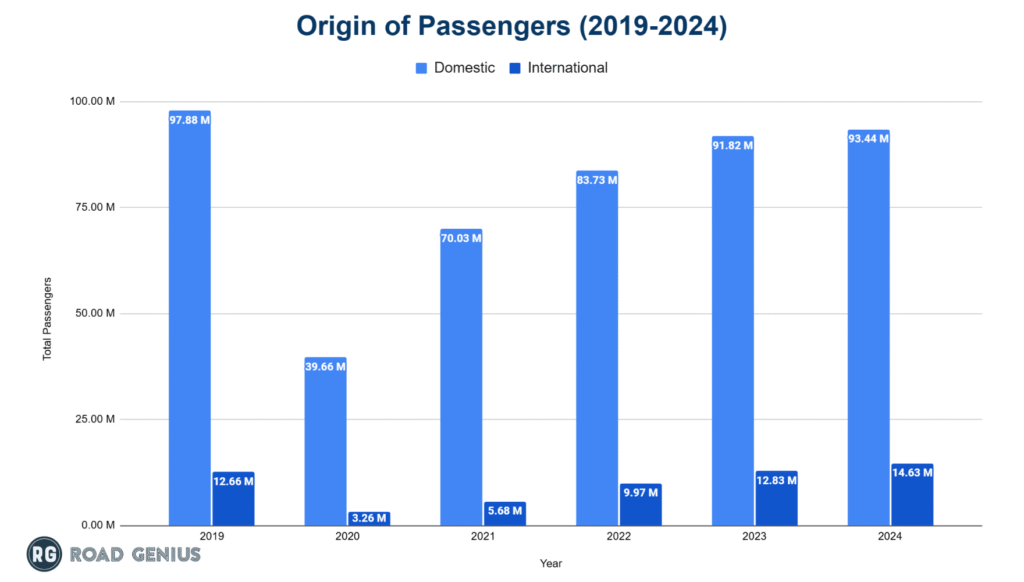
The passenger mix remains heavily domestic, although international demand is growing:
- Domestic passengers (2024): 93.5 million (86.5% of total)
- International passengers (2024): 14.6 million (13.5% of total), up 14% year‑over‑year.
Arrivals vs Departures
At ATL, passenger traffic shows a nearly equal flow in both directions for both domestic and international flights.
- For international operations, 7.31 million passengers arrived, while 7.32 million departed.
- In the domestic sector, 46.78 million passengers arrived and 46.65 million departed.
Number of passengers by arrival and departure (2019-24)
| Year | Domestic Departure | Domestic Arrival | International Departure | International Arrival |
| 2019 | 48.92 M | 48.96 M | 6.33 M | 6.32 M |
| 2020 | 19.83 M | 19.83 M | 1.55 M | 1.71 M |
| 2021 | 35.00 M | 35.02 M | 2.83 M | 2.85 M |
| 2022 | 41.80 M | 41.93 M | 4.99 M | 4.98 M |
| 2023 | 45.83 M | 45.99 M | 6.42 M | 6.41 M |
| 2024 | 46.65 M | 46.78 M | 7.32 M | 7.31 M |
What is the total number of aircraft operations at the airport each year?
The airport recorded a total of 796,224 aircraft operations (takeoffs and landings) in 2024, reflecting a strong level of activity.
- ATL recorded 796,224 aircraft operations in 2024.
- The record remains 904,301 operations in 2019.
- Annual totals dipped to 548,016 in 2020 before rebounding to 707,661 in 2021, 724,145 in 2022, and 775,818 in 2023.

International vs Domestic Operations
The airport handles a higher number of domestic aircraft operations compared to international ones.
- The international operations accounted for 80,680 flights, a 15.8% increase compared to the previous year.
- Domestic operations were much higher compared to international operations, totaling 715,544 flights, a slight 1.3% higher than the previous year.

Aircraft Operations by Type
- Domestic air carrier operations totaled 700,541 in 2024, followed by air taxi with 8,034, general aviation with 6,673, and military with 296.
- International operations consisted only of air carrier flights, totaling 80,680.
Aircraft Operations at ATL International Airport by Type
| Type | 2019 | 2020 | 2021 | 2022 | 2023 | 2024 |
| Domestic Air Carrier | 735,523 | 464,706 | 617,226 | 614,505 | 685,879 | 700,541 |
| Domestic Air Taxi | 84,647 | 50,489 | 40,530 | 43,819 | 13,573 | 8,034 |
| General Aviation | 7,102 | 3,867 | 5,287 | 6,601 | 6,471 | 6,673 |
| Military | 232 | 225 | 293 | 253 | 224 | 296 |
| International Air Carrier | 76,797 | 28,729 | 44,325 | 58,967 | 69,671 | 80,680 |
Which airlines operate the most flights out of ATL International Airport?
Delta Air Lines dominates operations at ATL, creating one of the world’s largest single-airline fortress hubs.
- Delta Air Lines remains the dominant carrier, operating roughly 74% of passenger flights in 2024.
- Southwest Airlines is a distant second at 7.4%.
- Frontier Airlines, Endeavor Air (operating for Delta), and Spirit Airlines round out the top five with 3.5%, 3.3% and 2.6% market share respectively.
Top 10 Airlines at ATL by Passenger Volume (2024)
| Airline | Domestic | International | Total | |
| 1 | Delta Air Lines | 68.88 M | 11.10 M | 79.98 M |
| 2 | Southwest Airlines | 7.92 M | 0.03 M | 7.95 M |
| 3 | Frontier Airlines | 3.53 M | 0.27 M | 3.80 M |
| 4 | Endeavor Air dba DL | 3.46 M | 0.08 M | 3.54 M |
| 5 | Spirit Airlines | 2.83 M | 0 | 2.83 M |
| 6 | American Airlines | 2.44 M | 0 | 2.44 M |
| 7 | United Airlines | 1.96 M | 0 | 1.96 M |
| 8 | SkyWest Airlines dba DL | 0.97 M | 0 | 0.97 M |
| 9 | JetBlue Airways | 0.72 M | 0 | 0.72 M |
| 10 | Alaska Airlines | 0.42 M | 0 | 0.42 M |
Atlanta Travel Resource
Trends in passenger traffic at ATL
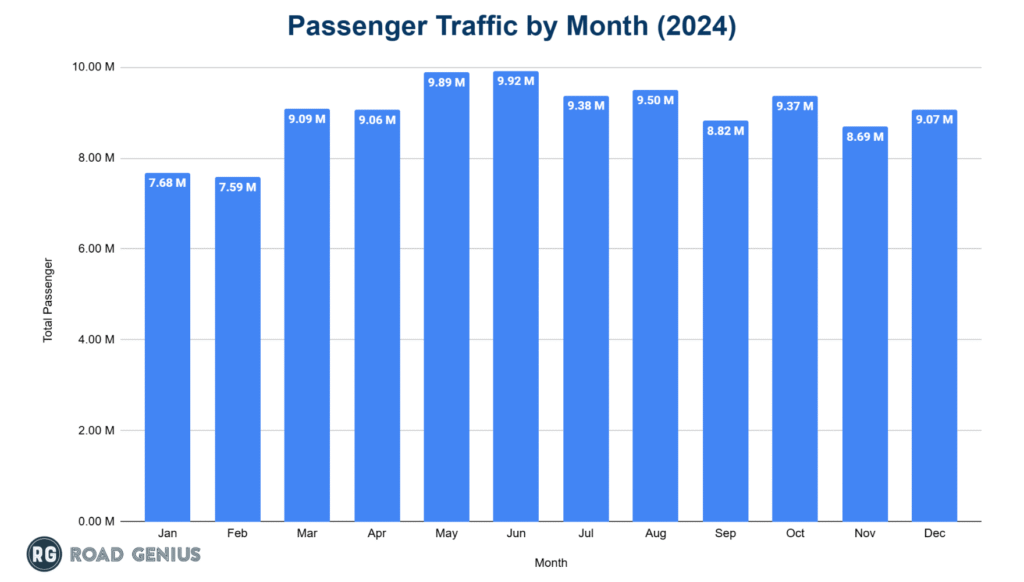
ATL international airport receives around 9 million passengers each month.
- June was the busiest month in 2024 with 9.92 million travelers, closely followed by May (9.89 million).
- August and July recorded 9.50 million and 9.38 million passengers, respectively.
- October maintained 9.37 million passengers.
Which destinations are the most popular from Hartsfield-Jackson Atlanta International Airport?
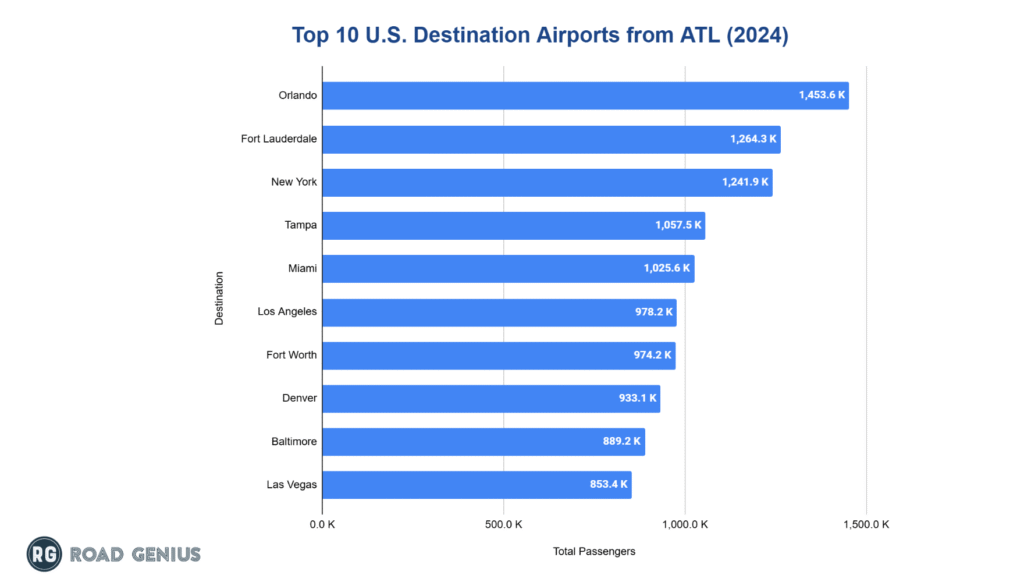
ATL offers extensive connectivity with over 245 destinations, heavily concentrated on major population centers and leisure destinations.
- Orlando, Florida (MCO) consistently ranks as the top domestic destination, handling 1.45 million passengers in 2024 and served by Delta, Frontier, Southwest, and Spirit airlines.
- Florida destinations dominate the top routes, with Fort Lauderdale (1.26 million), Tampa (1.06 million), and Miami (1.03 million) all ranking in the top five most-traveled destinations.
- Major business and leisure hubs complete the top domestic routes, including New York (LGA) (1.24 million), Los Angeles (978,200), Dallas-Fort Worth (974,200), and Denver (933,100).
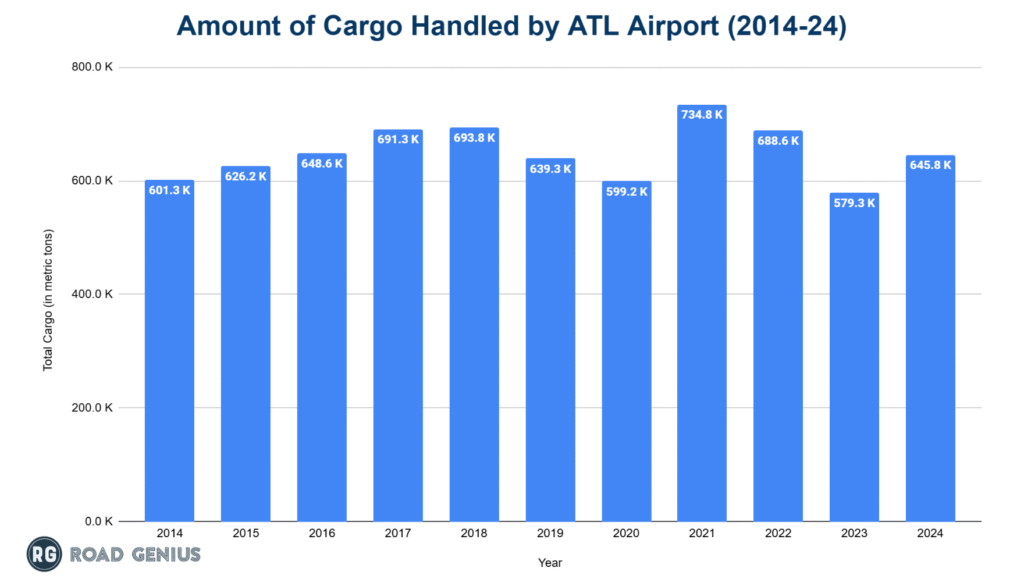
How much cargo does Hartsfield-Jackson Atlanta International Airport handle annually?
ATL processes about 600,000 metric tons of cargo annually.
- Annual cargo ranged from 579,331 metric tons in 2023 to a peak of 734,771 metric tons in 2021.
- In 2024, the airport handled 645,834 metric tons, reflecting a moderate increase from the previous year.
Delays and cancellations at ATL in 2024
- On‑time departures: 79% (up from 78% in 2023)
- On‑time arrivals: 82% (steady year‑over‑year)
- Cancellation rate: 1% (up from 0.82% in 2023)
- Average departure delay: 64.73 minutes (60.73 minutes in 2023)
- Average arrival delay: 76.70 minutes (75.74 minutes in 2023)
What are the main causes of flight disruptions at Hartsfield-Jackson Atlanta International Airport?
Weather emerges as the primary cause of flight disruptions at ATL, with the airport’s hub status amplifying the impact of local weather events.
- Thunderstorms represent the most common cause of major disruptions, particularly during summer months when Atlanta experiences frequent severe weather events.
- One severe thunderstorm can lead to more than 450 flight cancellations in a single day, creating logistical challenges for airlines and travelers nationwide.
Airport safety incident statistics
- The Federal Aviation Administration recorded 14 runway incursions in fiscal year 2023, equating to roughly 18 incursions per one million operations.
- Between 2004 and 2014, ATL ranked third nationwide with 187 runway incursions; only three incidents were classified as serious.
Other Key Facts
- ATL contributes an estimated $34.8 billion to the metro Atlanta economy.
- More than 63,000 people work at the airport, making it Georgia’s largest single‑site employer.
- The airport spans 4,700 acres and includes two passenger terminals linked to seven concourses with 193 gates.
- ATL plans to expand capacity to 125 million annual passengers within five years through infrastructure upgrades and process improvements.
Other US Airport Statistics
- George Bush Intercontinental Airport (IAH)
- Harry Reid International Airport (LAS)
- Hartsfield–Jackson Atlanta International Airport (ATL)
- John F. Kennedy International Airport (JFK)
- LaGuardia Airport (LGA)
- Los Angeles International Airport (LAX)
- Logan International Airport (BOS)
- Miami International Airport (MIA)
- Newark Liberty International Airport (EWR)
- Orlando International Airport (MCO)
America & USA Travel Statistics Resources
- Arizona Statistics
- California Statistics
- Canada Statistics
- Colorado Statistics
- Florida Statistics
- Georgia Statistics
- Hawaii Statistics
- Illinois Statistics
- Louisiana Statistics
- Massachusetts Statistics
- Mexico Statistics
- Nevada Statistics
- New York Statistics
- Panama Statistics
- Peru Statistics
- South Dakota Statistics
- Tennessee Statistics
- Texas Statistics
- Utah Statistics
- Washington Statistics
