Page last updated: 2 March 2026
Dallas Fort Worth International Airport (DFW) is one of the busiest airport hubs in the world. It serves as the primary entry point to North Texas and an important connection point for global air travel.
How many passengers pass through Dallas-Fort Worth International Airport each year?
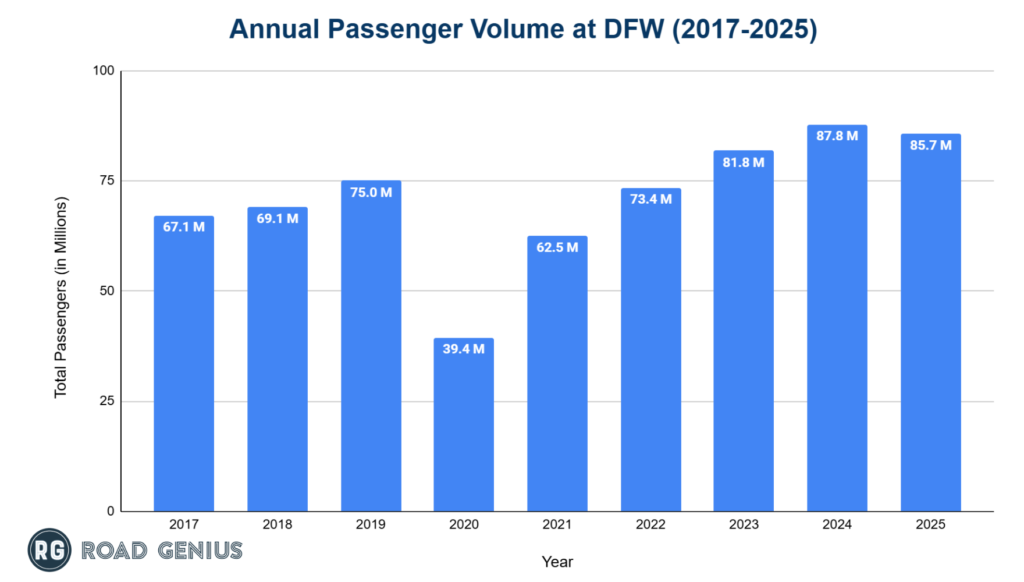
DFW consistently ranked among the three busiest airports worldwide by passenger volume, handling nearly 86 million travelers in 2025.
- DFW welcomed 85.7 million passengers in 2025, a 2.4% decrease compared to the 2024 record (87.8 million).
- The airport reached its pre-pandemic high in 2019 with 75 million passengers before traffic fell to 39.4 million in 2020 because of global travel restrictions.
- Passenger numbers rebounded to 62.5 million in 2021, 73.4 million in 2022, and 81.8 million in 2023 before setting the 2024 record.
International vs Domestic Passengers
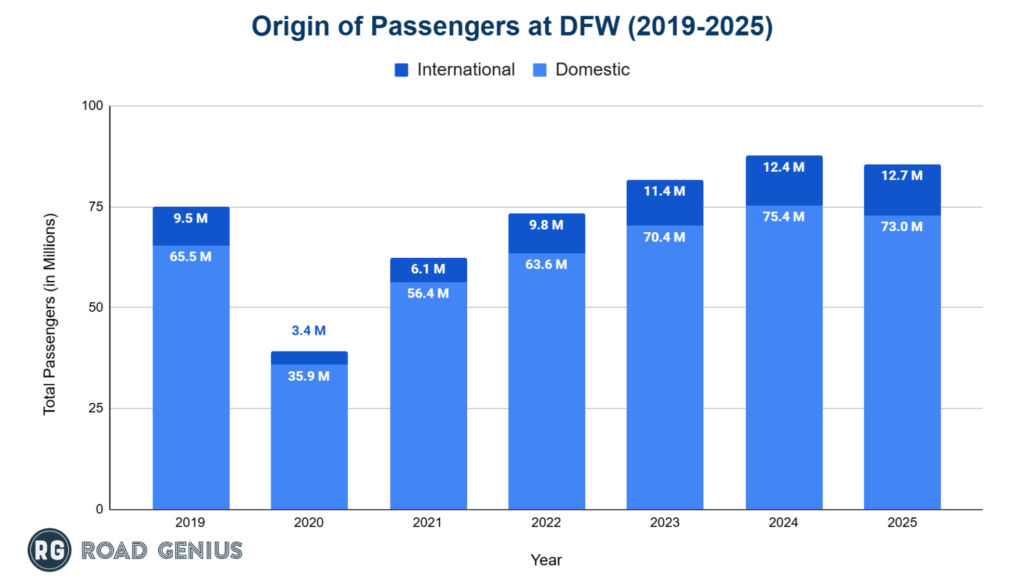
Although DFW is primarily a domestic hub, international traffic is growing faster.
- Domestic travel: 73 million passengers in 2025 (85.2% of the total).
- International travel: 12.7 million passengers in 2025 (14.8% of the total), up 2.4% from 2024.
Arrivals vs Departures
DFW’s passenger flow is nearly balanced, typical for a large connecting hub.
- In 2024, passenger traffic was evenly split between 43.9 million arrivals and 43.9 million departures.
- The airport processed 37.7 million domestic arrivals and departures each, along with 6.2 million international arrivals and departures.
Note: 2025 arrival and departure data are not available yet
What is the total number of aircraft operations at Dallas-Fort Worth International Airport each year?
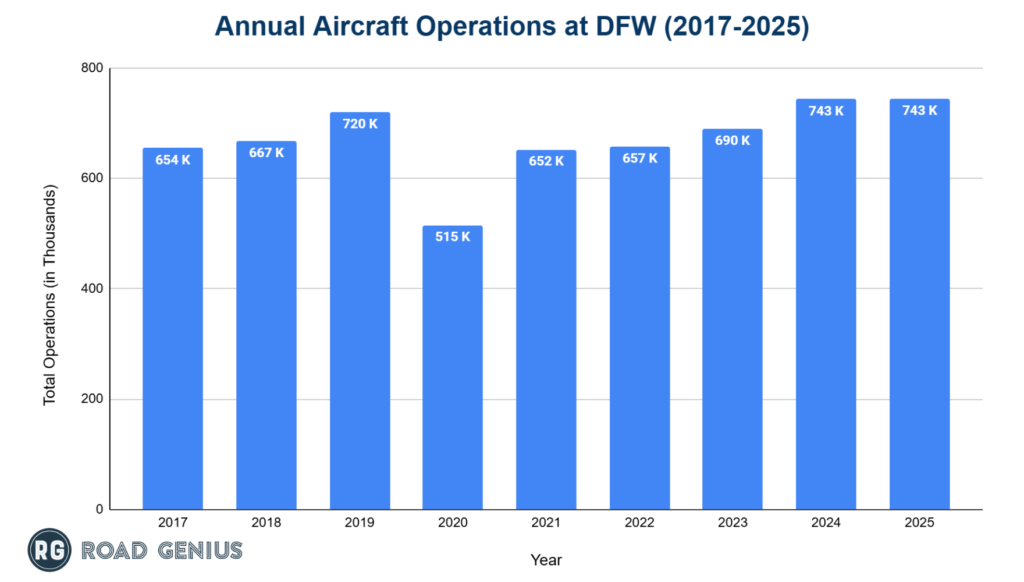
DFW handles more than 700,000 takeoffs and landings annually.
- DFW recorded 743,394 operations in 2025, an average of more than 2,000 movements per day.
- Operations surpassed the pre‑pandemic 720,007 operations in 2019.
- Counts fell to 514,702 in 2020 and then climbed to 651,895 in 2021 and 656,676 in 2022.
- In 2024, the airport recorded 743,203 operations, up 7.8% from 2023.
Aircraft Operations by Type
- The majority of operations at DFW airport were conducted by air carriers, totaling 723,839 in 2025.
- Moreover, air taxi operations accounted for 14,397 movements, followed by 5,085 from general aviation and 73 from military flights.
Aircraft Operations at DFW by Type (2019-2025)
| Type | 2019 | 2020 | 2021 | 2022 | 2023 | 2024 | 2025 |
| Air Carrier | 625,731 | 443,855 | 568,259 | 591,660 | 667,759 | 722,398 | 723,839 |
| Air Taxi | 88,137 | 66,723 | 77,927 | 58,888 | 16,419 | 14,870 | 14,397 |
| General Aviation | 5,937 | 3,904 | 5,507 | 5,974 | 5,250 | 5,724 | 5,085 |
| Military | 202 | 220 | 202 | 154 | 141 | 211 | 73 |
Note: Air taxi operations refer to on-demand commercial flights using small aircraft and are listed separately from general aviation, which includes all non-scheduled civil aviation activities outside commercial airline services.
Which airlines operate the most flights out of Dallas-Fort Worth International Airport?
American Airlines operates the vast majority of flights at DFW, making the airport its largest global hub.
- American Airlines: 82.6% passenger market share in 2025 (70.8 million passengers).
- Low‑cost carriers (e.g. Spirit, Frontier): 6.6% (5.6 million passengers).
- Non‑hub U.S. carriers (e.g. Delta, United): 7% (6 million passengers).
- Foreign flag carriers:3.7%.
Airline Category at DFW by Passenger Volume (2019-2025)
| Airline Category | 2019 | 2020 | 2021 | 2022 | 2023 | 2024 | 2025 |
| American | 63,949,751 | 34,769,297 | 54,282,627 | 61,745,572 | 67,423,747 | 71,908,767 | 70,779,859 |
| Low-Cost Carriers | 5,557,760 | 2,160,552 | 3,960,267 | 5,100,305 | 5,822,031 | 6,806,160 | 5,648,469 |
| Non-Hub Carriers | 3,636,533 | 1,886,197 | 3,240,759 | 4,455,702 | 5,827,473 | 6,099,679 | 5,972,966 |
| Foreign Flag Carriers | 1,789,853 | 507,840 | 922,300 | 1,983,215 | 2,594,875 | 2,898,300 | 3,139,139 |
| Other/Non-Scheduled | 75,663 | 41,104 | 59,803 | 78,152 | 87,412 | 104,958 | 119,694 |
Trends in Passenger Traffic at DFW
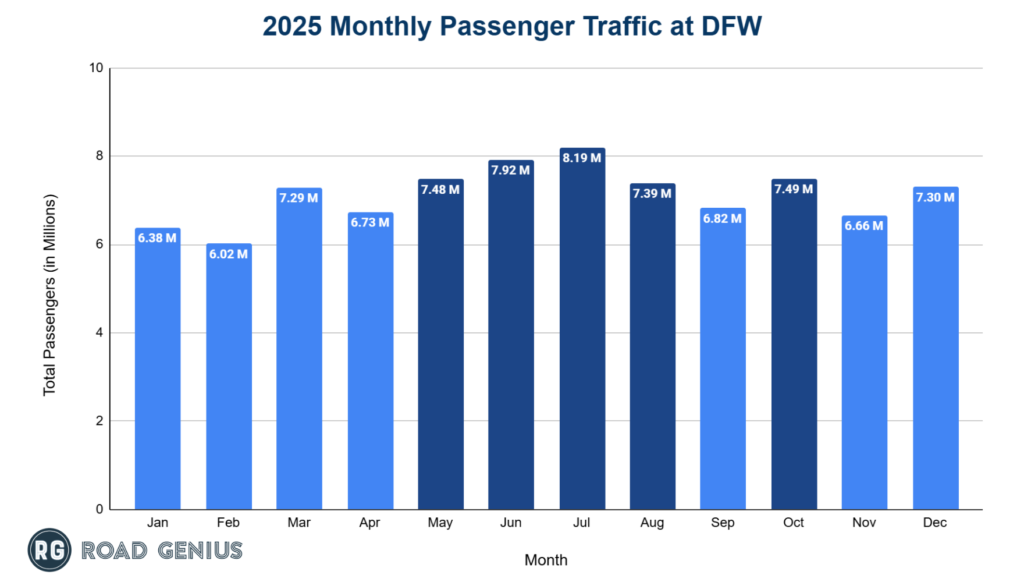
Passenger traffic fluctuated during the first half of the year before peaking in July, and then slightly declined toward the end of the year.
- July recorded the highest passenger traffic in 2025 at 8.19 million, followed by June with 7.92 million.
- May and October all saw noticeable amounts of traffic with 7.48 million and 7.49 million passengers, respectively.
- The lowest traffic was observed in January and February, at 6.38 million and 6.02 million respectively.
Most Popular Destinations
Domestic Destinations
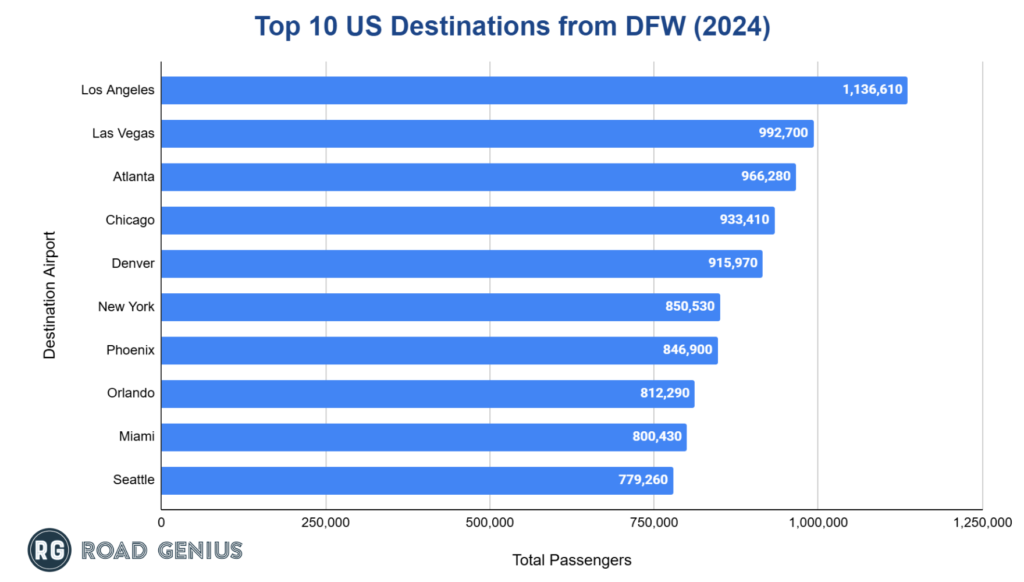
- The most popular domestic destination from Dallas Fort Worth International Airport (DFW ) in 2024 was Los Angeles (1.14 million passengers).
- Las Vegas (980,000) and Atlanta (968,000) are the next most traveled routes.
- Chicago (936,000) and Denver (911,000) round out the top five destinations.
Top International Destinations
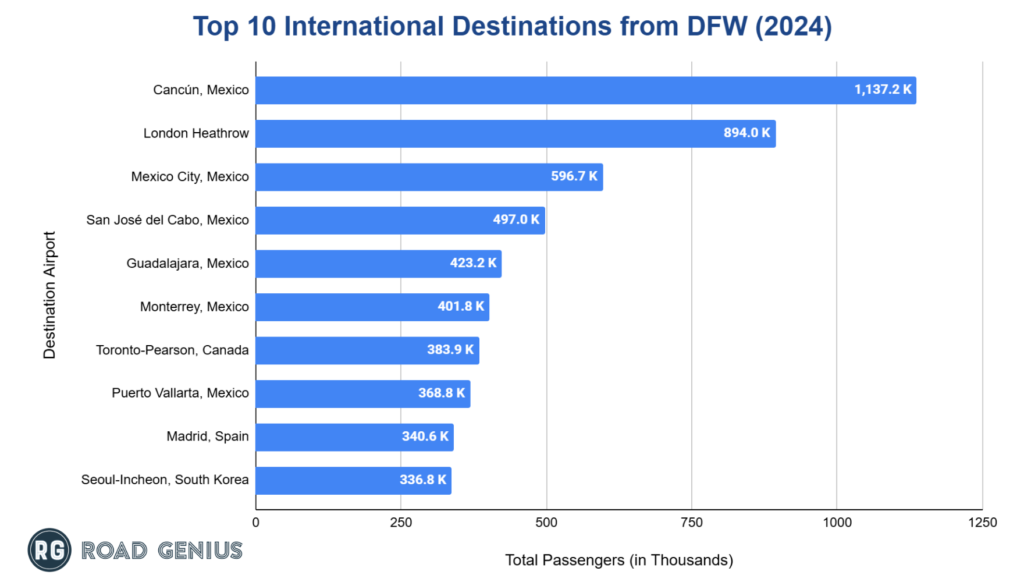
- Cancún, Mexico (CUN), with 1.14 million passengers, was the most popular international destination from Dallas Fort Worth International Airport (DFW) in 2024.
- London, United Kingdom (LHR) and Mexico City, Mexico (MEX) follow with 894,026 and 596,715 passengers, respectively.
- San José del Cabo (496,963) and Guadalajara (423,245), both in Mexico, complete the top five international destinations.
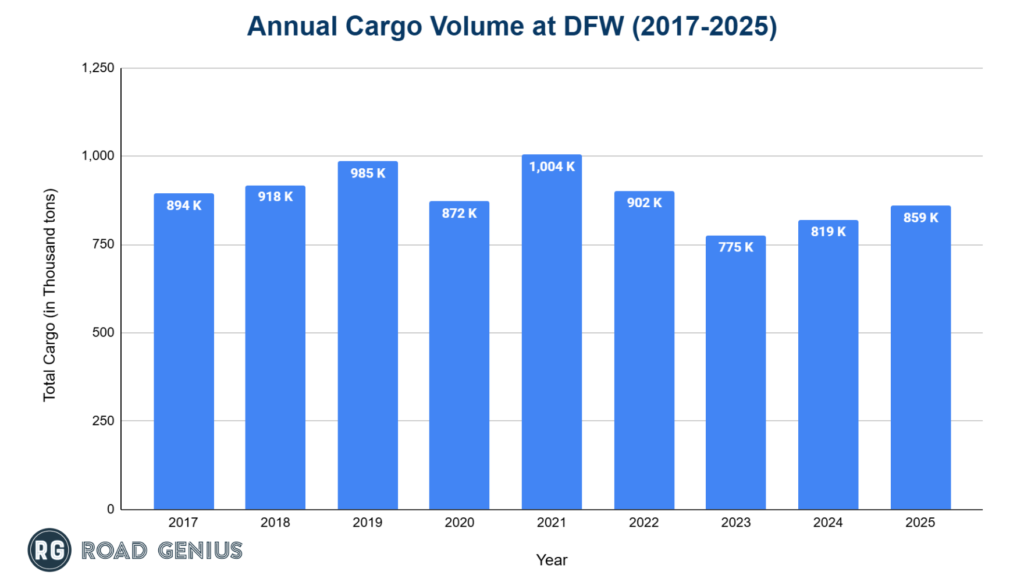
How much cargo does Dallas Fort Worth International Airport handle annually?
DFW handles more than 800,000 U.S. tons of cargo per year, making it a major cargo hub and a significant economic engine for North Texas.
- 858,952 tons in 2025, up 4.9% from 818,625 tons in 2024.
- The airport exceeded 1 million tons in 2021, a record achievement.
Delays and Cancellations at Dallas-Fort Worth International Airport
- On‑time departures: 71% in 2024, down from 75% in 2023 (30th among major U.S. airports).
- On‑time arrivals: 74% in 2024, down from 77% in 2023.
- Cancellation rate: 1.86% in 2024, up from 1.55% in 2023.
- Average departure delay: 74.18 minutes in 2024 (73.85 minutes in 2023).
- Average arrival delay: 89.55 minutes in 2024 (88.72 minutes in 2023).
What are the main causes of flight disruptions at Dallas Fort Worth International Airport?
Weather is the leading cause of flight disruptions at DFW.
- Severe thunderstorms are the primary issue because of DFW’s North Texas location.
- Network ripple effects can amplify local weather impacts; as American Airlines’ largest hub, delays at DFW can cascade across the national system.
Airport Incident Statistics at DFW
- May 28, 2021: Boeing 737‑823 ground collision- substantial aircraft damage, no injuries (160 passengers, six crew).
- May 23, 2001: American Airlines Fokker 100 main‑gear collapse on landing- no injuries.
- August 31, 1988: Delta Air Lines Flight 1141 crash after takeoff- 12 passenger and two crew fatalities.
- August 2, 1985: Delta Air Lines Flight 191 crash on approach- 134 passenger and crew fatalities, plus one ground fatality.
Other Key Statistics
- DFW generates more than $37 billion in annual economic impact and supports about 634,000 direct and indirect jobs.
- Visitor spending at the airport adds about $24 billion to the local economy.
- DFW projects serving more than 100 million passengers annually by 2030, necessitating major infrastructure investments.
- The airport aims for net‑zero carbon emissions by 2030, 20 years ahead of the aviation industry’s 2050 target.
How many car rental brands operate at Dallas Fort Worth Airport?
- 9 rental car brands operate at Dallas Fort Worth Airport, with a total of over 15 car rental suppliers across Dallas.
What is the average cost of renting a car at Dallas Fort Worth Airport?
- On average, car rentals at Dallas Fort Worth Airport cost around $94 per day, with the lowest-priced rentals available from $17 per day.
Dallas Travel Resources
- Car hire prices in Dallas
- Dallas to Austin Car Rentals
- Dallas to Galveston Car Rentals
- Dallas to Houston Car Rentals
- Dallas to New York Car Rentals
Other US Airport Statistics
- Charlotte Douglas International Airport Statistics
- Denver International Airport
- Detroit Metropolitan Airport Statistics
- Fort Lauderdale-Hollywood International Airport (FLL) Statistics
- George Bush Intercontinental Airport (IAH) Statistics
- Harry Reid International Airport (LAS)
- Hartsfield–Jackson Atlanta International Airport
- John F. Kennedy International Airport Statistics
- LaGuardia Airport (LGA) Statistics
- Logan International Airport (BOS) Statistics
- Los Angeles International Airport
- Miami International Airport
- Minneapolis-Saint Paul International Airport (MSP) Statistics
- Newark Liberty International Airport (EWR) Statistics
- Orlando International Airport (MCO)
- O’Hare International Airport
- Phoenix Sky Harbor International Airport Statistics
- San Francisco International Airport Statistics
- Seattle-Tacoma International Airport Statistics
America & USA Travel Statistics Resources
- Arizona Statistics
- California Statistics
- Canada Statistics
- Colorado Statistics
- Dallas Statistics
- Florida Statistics
- Georgia Statistics
- Hawaii Statistics
- Illinois Statistics
- Louisiana Statistics
- Massachusetts Statistics
- Mexico Statistics
- Nevada Statistics
- New York Statistics
- Panama Statistics
- Peru Statistics
- South Dakota Statistics
- Tennessee Statistics
- Texas Statistics
- Utah Statistics
- Washington Statistics