Page last updated: 8 October 2025
LaGuardia Airport (LGA) is New York City’s main air hub for business and short-haul flights. Situated in Queens, approximately 8 miles from Midtown Manhattan and links the Northeast with destinations across the United States.
How many passengers pass through LaGuardia Airport each year?
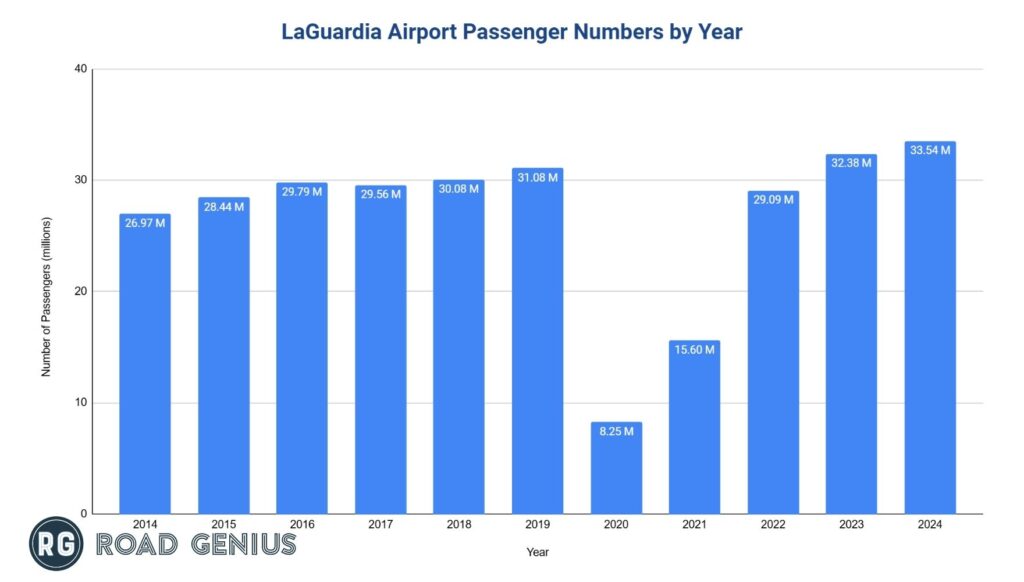
Over 33 million passengers pass through LaGuardia Airport (LGA) each year.
- In 2024, LGA handled 33.54 million passengers, up approximately 4% from 2023 and 8% above pre-pandemic 2019 levels.
- Annual passenger traffic reached 32.38 million in 2023, continuing the recovery from pandemic lows. There were 29.09 million travelers in 2022 and 15.60 million in 2021.
- Before the pandemic, 31.08 million passengers traveled through LGA in 2019, which dropped to 8.25 million in 2020 during the pandemic low.
How many passengers passed through LaGuardia Airport in 2024?
Approximately 33.54 million passengers passed through LaGuardia Airport in 2024.
- LGA handled 31.81 million domestic passengers (95%) and 1.73 million international passengers (5%) of total airport traffic in 2024.
How many passengers passed through LaGuardia Airport in 2023?
Approximately 32.38 million passengers passed through LaGuardia Airport in 2023.
- LGA handled 30.58 million domestic passengers (94%) and 1.81 million international passengers (6%) of total airport traffic in 2023.
How many arrivals and departures occur at LaGuardia Airport in 2024?
- LaGuardia Airport processed approximately 16.77 million arrivals and 16.77 million departures in 2024.
How large is LaGuardia Airport?
LaGuardia Airport spans approximately 680 acres of land in Queens, New York.
- Runways: 2 closely spaced parallel runways
- Terminals: 4 (A, B, C and Marine Air Terminal) with 78 gates
- Parking: 8,000+ spaces across terminal garages
- Design capacity: 35 million+ passengers annually following the $8 billion redevelopment
What is the number of aircraft operations at LaGuardia Airport each year?
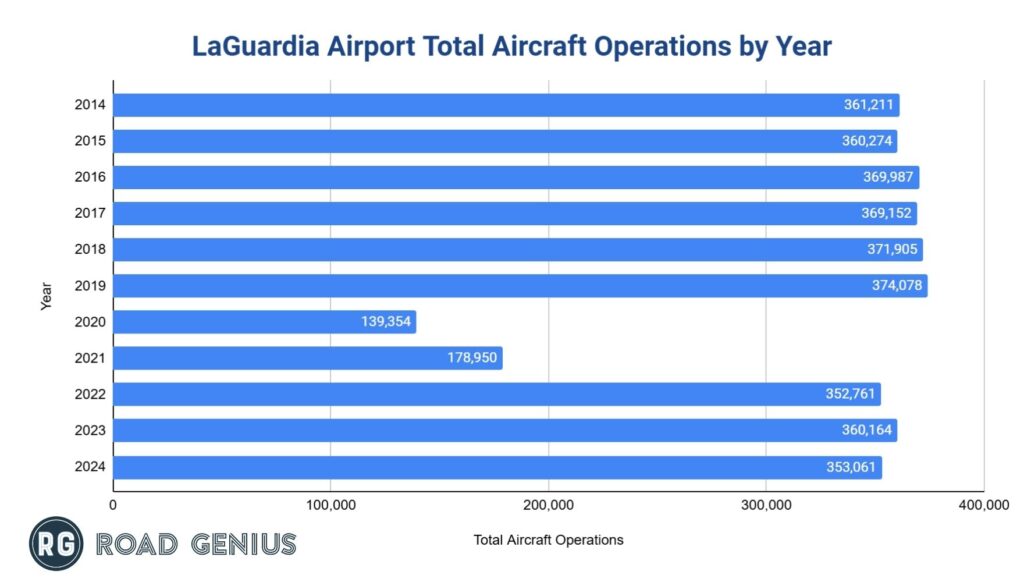
Over 353,000 aircraft operations (including takeoffs and landings) occur at LaGuardia Airport (LGA) each year.
- In 2024, LGA handled 353,061 operations, down approximately 2% from 2023 but at 94% of the pre-pandemic 2019 levels.
- Annual aircraft operations reached 360,164 in 2023, continuing the recovery from pandemic lows, with over 352,761 operations in 2022 and 178,950 in 2021.
- Before the pandemic, 374,078 operations occurred at LGA in 2019, which dropped to 139,354 in 2020 during the pandemic low.
Aircraft Operations by Type
- Air Carrier and Air Taxi flights dominated with 344,096 operations in 2024, representing 97.5% of total activity.
- General Aviation recorded 8,700 operations (approximately 2.5%), while Military aircraft accounted for the remaining 265 operations.
| LaGuardia Airport Aircraft Operations Type | ||||||
| Operations Type | 2019 | 2020 | 2021 | 2022 | 2023 | 2024 |
| Air Carrier | 179,497 | 75,283 | 87,312 | 167,620 | 174,600 | 168,541 |
| Air Taxi/Regional | 182,513 | 60,330 | 86,902 | 166,860 | 177,200 | 175,555 |
| General Aviation | 11,908 | 3,646 | 4,536 | 17,881 | 7,944 | 8,700 |
| Military | 160 | 95 | 200 | 400 | 430 | 265 |
| Total Operations | 374,078 | 139,354 | 178,950 | 352,761 | 360,164 | 353,061 |
How much revenue does LaGuardia Airport generate each year?
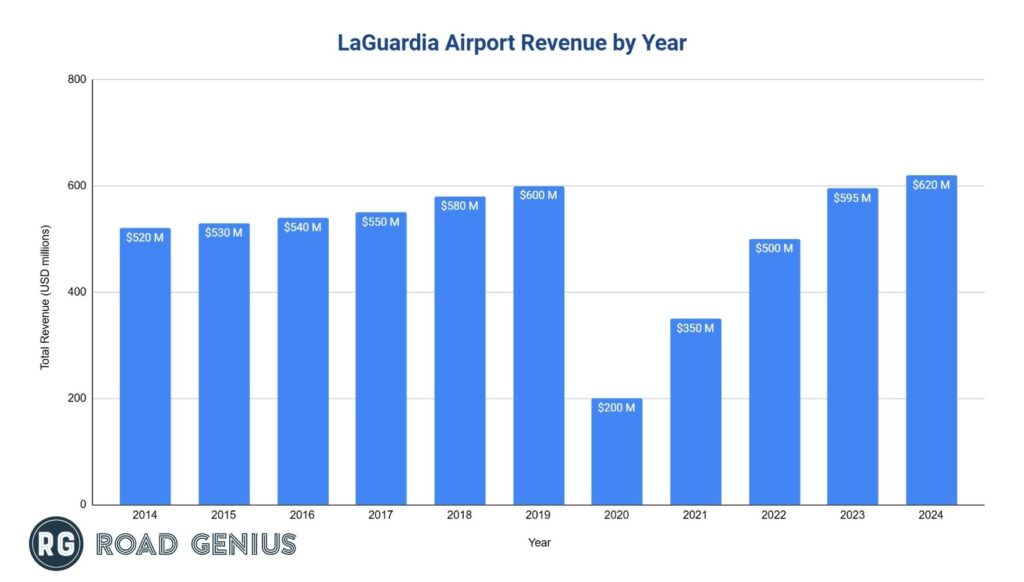
LaGuardia Airport (LGA) generates over $620 million in revenue each year.
- In 2024, LGA generated $620 million in revenue, up approximately 4% from 2023 and approximately 3% above pre-pandemic 2019 levels.
- Annual revenue reached $595 million in 2023, continuing the recovery from pandemic lows, with $500 million in 2022.
- Before the pandemic, $600 million in revenue was generated in 2019, which dropped to approximately $200 million in 2020 during the pandemic.
LaGuardia Airport Revenue in 2024
Approximately $620 million in revenue was generated by LaGuardia Airport (LGA) in 2024.
- LGA contributed $330 million from aeronautical revenue (53%) and $290 million from non-aeronautical revenue (47%) of total airport revenue in 2024.
LaGuardia Airport Revenue in 2023
Approximately $595 million in revenue was generated by LaGuardia Airport (LGA) in 2023.
- LGA contributed $320 million from aeronautical revenue (54%) and $275 million from non-aeronautical revenue (46%) of total airport revenue in 2023.
Which is the busiest terminal at LaGuardia Airport?
Terminal C was the busiest terminal with 13.33 million passengers in 2024, handling approximately 40% of total airport traffic at LaGuardia Airport (LGA).
LaGuardia Airport Terminals by Passenger Volume (2024)
- Terminal C (Delta Hub): 13.33 million passengers (Delta Air Lines operations)
- Terminal B (Central Terminal): 12 million passengers (American Airlines, JetBlue, Southwest)
- Terminal A (Historic): 6 million passengers (mixed carriers)
- Marine Air Terminal: 2.21 million passengers (shuttle services)
Which airlines carry the most passengers at LaGuardia Airport?
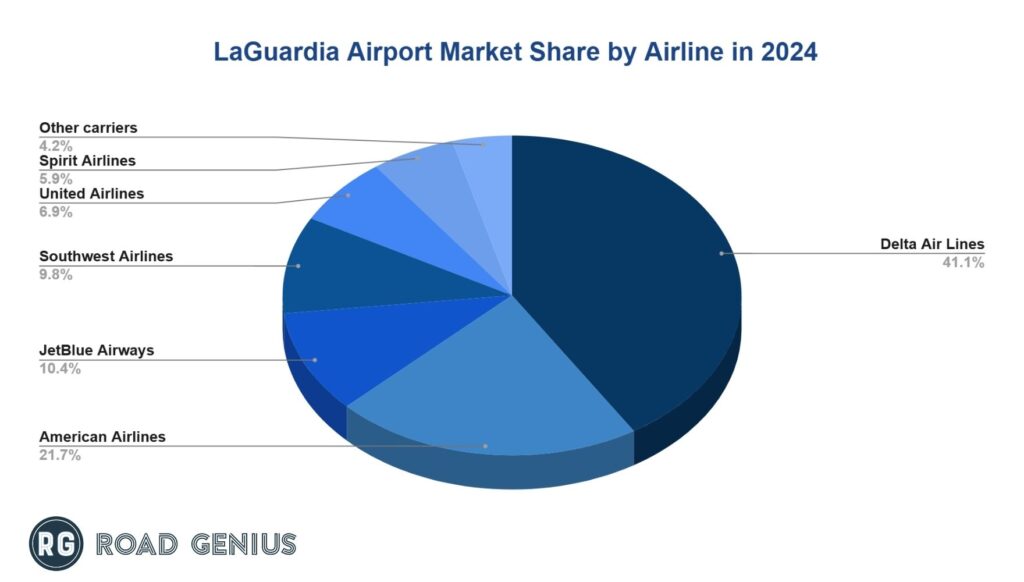
Delta Air Lines carried the most passengers in 2024 with a 41.1% market share at LaGuardia Airport (LGA), followed by American Airlines at approximately 21.7%.
Market Share by Airline at LGA (2024)
- Delta Air Lines: 41.1% (13.33 million passengers)
- American Airlines: 21.7% (7.02 million passengers)
- JetBlue Airways: 10.4% (3.36 million passengers)
- Southwest Airlines: 9.8% (3.18 million passengers)
- United Airlines: 6.9% (2.22 million passengers)
- Spirit Airlines: 5.9% (1.93 million passengers)
- Other carriers: 4.2% (2.5 million passengers)
What are the busiest routes at LaGuardia Airport?
The busiest domestic routes at LaGuardia Airport (LGA) reflect New York’s strong business connections and leisure travel patterns to major U.S. destinations.
Top Domestic Routes by Passengers (2024)
- LGA – Chicago O’Hare (ORD): 1.31 million passengers
- LGA – Atlanta (ATL): 1.20 million passengers
- LGA – Miami (MIA): 876,000 passengers
- LGA – Dallas/Fort Worth (DFW): 847,000 passengers
- LGA – Orlando (MCO): 776,000 passengers
Top International Routes by Passengers (2024)
- LGA – Toronto Pearson (YYZ): 800,000 passengers
- LGA – Montreal (YUL): 300,000 passengers
- LGA – Nassau (NAS): Seasonal service (limited volume)
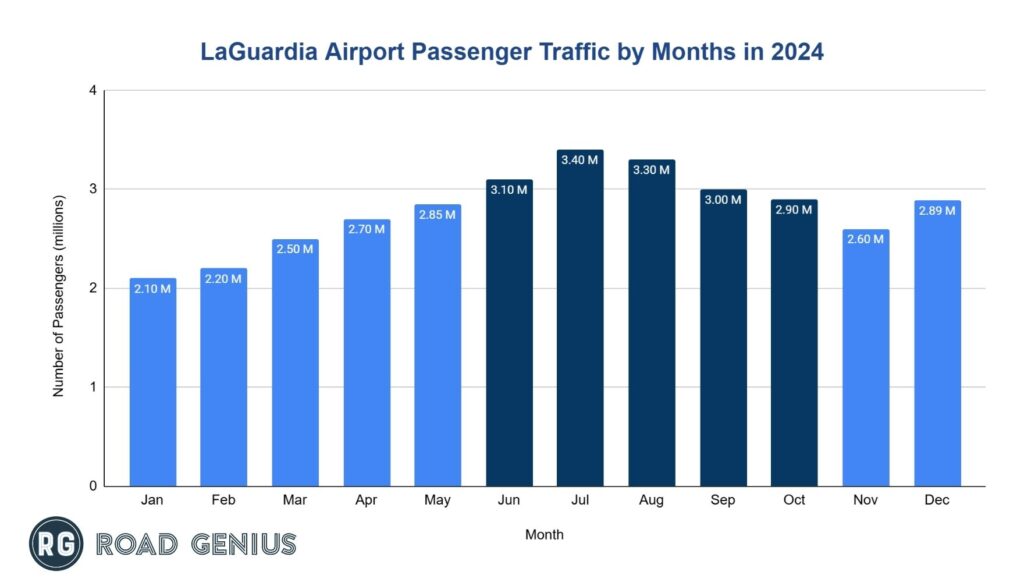
What are the monthly trends in passenger traffic at LaGuardia Airport?
July was the peak month at LaGuardia Airport (LGA) in 2024.
- July was the busiest month with approximately 3.40 million passengers, followed by August with 3.30 million and June with 3.10 million.
- In September handled around 3.00 million passengers, while October drew 2.90 million.
New York Travel Resources
- Car hire prices in New York (RV)
- New York to Boston Car Rentals
- New York to Los Angeles Car Rentals
- New York to Miami Car Rentals
- New York to Orlando Car Rentals
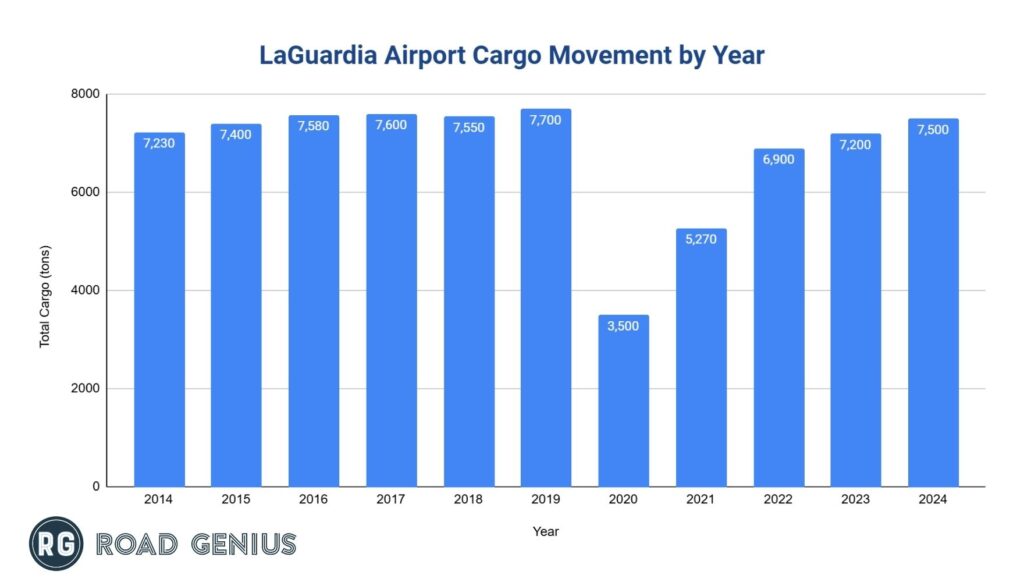
How much cargo moves through LaGuardia Airport each year?
Over 7,500 tons of cargo move through LaGuardia Airport (LGA) each year.
- In 2024, LGA processed 7,500 tons of cargo, up approximately 4% from 2023 and 3% below pre-pandemic 2019 levels.
- Annual cargo volumes reached 7,200 tons in 2023, continuing the recovery from pandemic lows, with 6,900 tons in 2022 and 5,270 tons in 2021.
- Before the pandemic, 7,700 tons of cargo moved through LGA in 2019, which dropped to 3,500 tons in 2020 during the pandemic low.
How reliable is LaGuardia Airport?
LaGuardia Airport (LGA) achieved an 81.3% on-time departure rate in 2024.
- Flight cancellations (2024): 2.5 % of scheduled flights
- Average delay (2024): 79 minutes
- Key factors: Afternoon congestion, Northeast weather, and runway constraints
- Best-performing airlines: Delta at 82% on-time departures and American at 78 %.
How does LaGuardia Airport rank globally?
LaGuardia Airport (LGA) ranks as the 19th busiest airport in the United States and does not rank in the top 50 globally due to its primarily domestic focus.
- Traffic mix: 95 % domestic traffic
- Business travel: High concentration, 24 % business vs 12 % U.S. average
What is LaGuardia Airport’s economic impact?
LaGuardia Airport contributes over $13.6 billion in annual economic activity across the New York region.
- Jobs supported: 62,000 (direct and indirect)
- Direct on-airport employment: 15,800 positions
- Annual wages: Approximately $6 billion
- Redevelopment impact: $8 billion project created 7,000 construction jobs
Other US Airport Statistics
- Charlotte Douglas International Airport
- Dallas-Fort Worth International Airport
- Denver International Airport
- Harry Reid International Airport
- Hartsfield–Jackson Atlanta International Airport
- John F. Kennedy International Airport
- Los Angeles International Airport
- Orlando International Airport
- O’Hare International Airport
USA Travel Statistics Resources
- Arizona Statistics (incl. Grand Canyon National Park)
- California Statistics (incl. Los Angeles, San Diego, San Francisco, Universal Studios Hollywood)
- Florida Statistics (incl. Destin, Key West, Miami, Orlando, Universal Orlando, Walt Disney World)
- Hawaii Statistics (incl. Kauai, Maui, Oahu)
- Illinois Statistics (incl. Chicago)
- Louisiana Statistics (incl. New Orleans)
- Massachusetts Statistics (incl. Boston)
- Nevada Statistics (incl. Las Vegas)
- New York Statistics (incl. New York City, Statue of Liberty)
- South Dakota Statistics (incl. Mount Rushmore)
- Tennessee Statistics (incl. Memphis, Nashville)
- Texas Statistics (incl. Dallas, Houston, San Antonio)
- Utah Statistics
- Washington Statistics (incl. Seattle)
- Yellowstone National Park Statistics
