Page last updated: 7 August, 2025
Chicago O’Hare International Airport (ORD) stands as one of the world’s busiest airports, serving as a critical hub for domestic and international air travel in the Midwest United States. The airport serves over 80 million passengers annually and operates as the second-busiest airport globally for aircraft movements.
How many passengers pass through O’Hare International Airport each year?
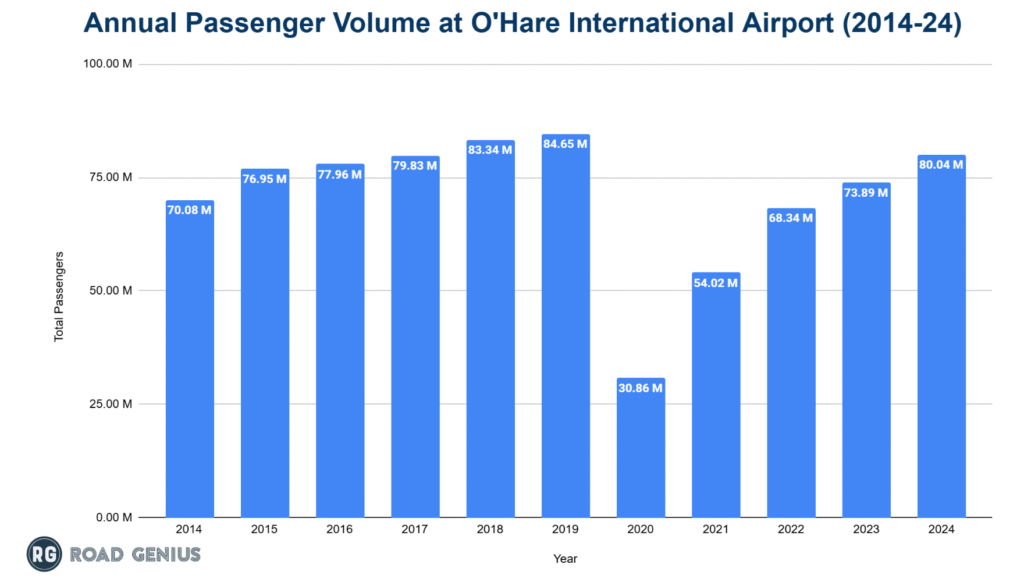
O’Hare International Airport handled over 80 million passengers in 2024, demonstrating strong recovery and growth in the post-pandemic era.
- Chicago O’Hare International Airport (ORD) handled 80.04 million passengers in 2024, an 8.3% increase from 73.9 million in 2023 and the largest percentage gain among major airports in the Americas.
- Passenger levels were 84.65 million in 2019, fell to 30.86 million in 2020 at the height of the pandemic, and rebounded to 54.02 million in 2021 and 68.34 million in 2022.
International vs Domestic Passengers
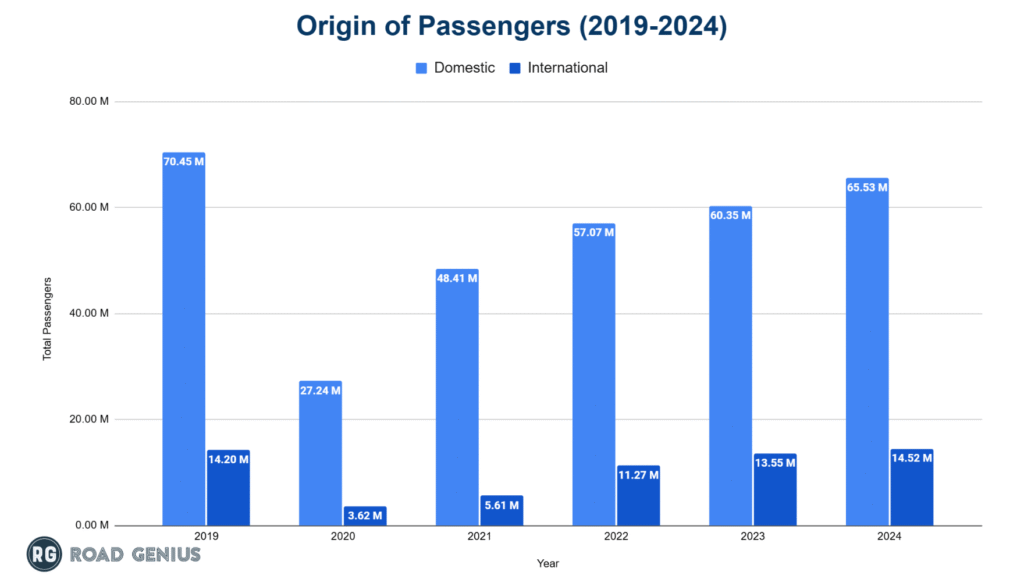
O’Hare maintains a heavily domestic-focused passenger profile, though international traffic represents a notable portion of operations.
- In 2024 domestic travel accounted for 65.53 million passengers (81.9% of the total), underscoring ORD’s role as a national hub.
- International passengers numbered 14.52 million (18.1%), a segment that continues to expand.
What is the total number of aircraft operations at O’Hare each year?
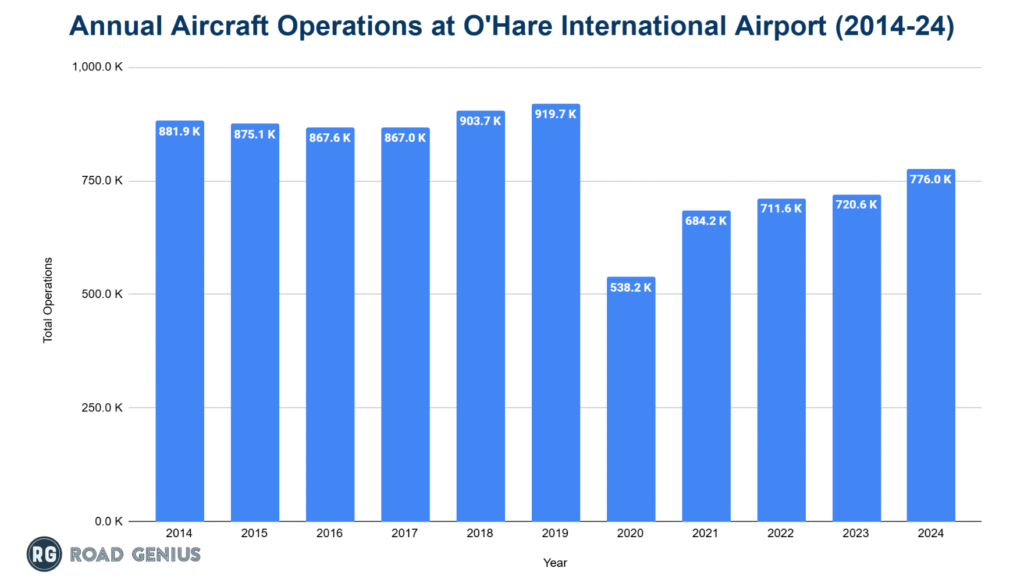
O’Hare records over 700,000 aircraft movements annually, making it the second-busiest airport in the world for flight operations.
- ORD recorded 776,036 aircraft movements in 2024, a 7.7% increase over 2023 (720,582 movements).
- Activity is about 84% of the 2019 pre‑pandemic peak of 919,704 movements.
- Operations dropped to 538,211 in 2020 before recovering to 684,201 in 2021 and 711,561 in 2022.
Aircraft Operations by Type
- The majority of operations at ORD airport were conducted by air carriers in both domestic and international segments, totaling 648,519 and 81,649 respectively.
- Moreover, cargo operators accounted for 12,609 and 16,852 movements respectively.
- 10,732 domestic operations were conducted by general aviation, while only the international segment accounted for only 11.
Aircraft Operations at O’Hare International Airport by Type (2019-24)
| Type | 2019 | 2020 | 2021 | 2022 | 2023 | 2024 | |
| Domestic | |||||||
| Air Carrier | 793,158 | 433,804 | 569,549 | 587,102 | 603,057 | 648,519 | |
| Cargo Operator | 11,031 | 14,480 | 13,667 | 14,717 | 12,535 | 12,609 | |
| General Aviation – FBO | 10,130 | 4,638 | 8,084 | 10,276 | 9,672 | 10,732 | |
| Miscellaneous | 5,840 | 26,953 | 15,358 | 6,760 | 2,050 | 5,664 | |
| Total | 820,159 | 479,875 | 606,658 | 618,855 | 627,314 | 677,524 | |
| International | |||||||
| Air Carrier | 86,165 | 41,940 | 59,458 | 76,839 | 78,202 | 81,649 | |
| Cargo Operator | 13,380 | 15,922 | 18,085 | 15,867 | 15,066 | 16,852 | |
| Miscellaneous | 0 | 474 | 0 | 0 | 0 | 11 | |
| Total | 99,545 | 58,336 | 77,543 | 92,706 | 93,268 | 98,512 |
Which airlines operate the most flights out of O’Hare International Airport?
United Airlines dominates O’Hare operations, with United and American Airlines together controlling approximately 75% of the market in a classic duopoly structure.
- Between February 2024 and January 2025, United Airlines led with 37.08 million passengers, capturing 46.3% of the market share.
- American Airlines followed with 23.4 million passengers and 29.2% share.
- Spirit Airlines and Delta Air Lines were nearly tied, each with around 3 million passengers and 3.7% market share.
- Southwest Airlines carried 1.51 million passengers, accounting for 1.9% of the market.
Top 10 Airlines at ORD Airport by Passenger Volume (Feb’24-Jan’25)
| Airline | Total Passenger | Market Share |
|---|---|---|
| United | 37.08 M | 46.3% |
| American | 23.40 M | 29.2% |
| Spirit | 2.98 M | 3.7% |
| Delta | 2.97 M | 3.7% |
| Southwest | 1.51 M | 1.9% |
| Frontier | 1.13 M | 1.4% |
| Alaska | 0.96 M | 1.2% |
| Volaris | 0.57 M | 0.7% |
| Lufthansa | 0.56 M | 0.7% |
| Air Canada | 0.55 M | 0.7% |
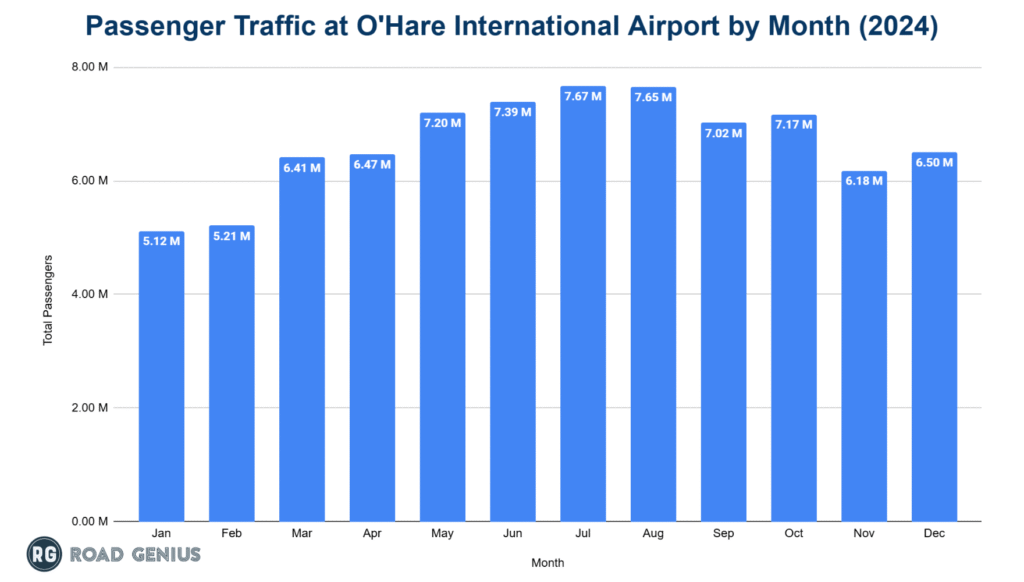
Monthly Trends in Passenger Traffic at O’Hare
- Passenger traffic at O’Hare peaks during the summer months, with July (7,666,522) and August (7,646,022) being the busiest.
- Travel remains high in May (7,197,283), June (7,393,848), and October (7,169,102).
- The least busy months are January (5,120,873) and February (5,206,510), reflecting lower winter demand.
Which destinations are the most popular from O’Hare International Airport?
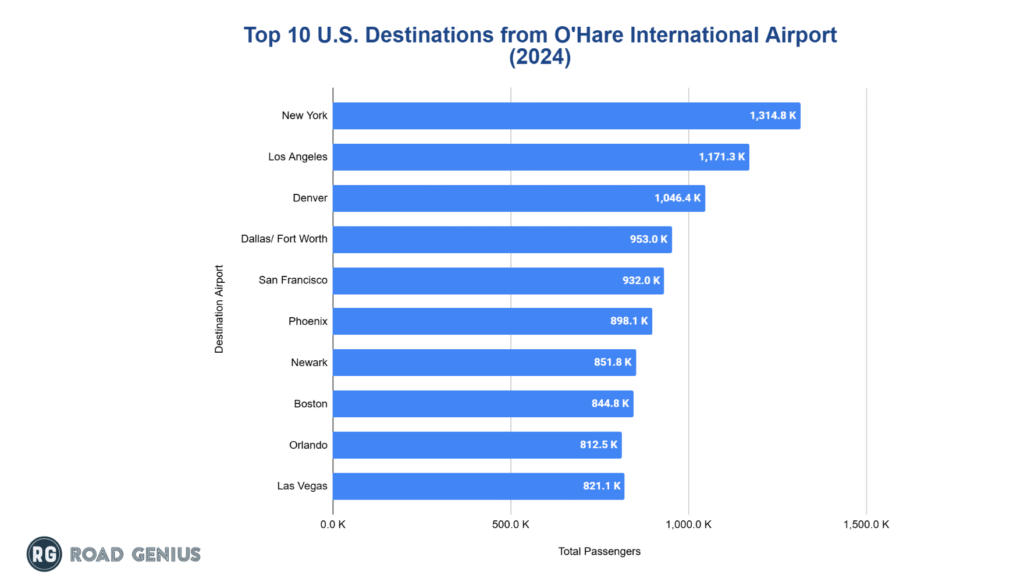
Domestic Destinations
- The most popular domestic destination from O’Hare International Airport (ORD ) in 2024 was New York (1.32 million passengers).
- Los Angeles (1.17 million) and Denver (1.05 million) are the next most traveled routes.
- Dallas/Fort Worth (953,000) and San Francisco (932,000) round out the top five destinations.
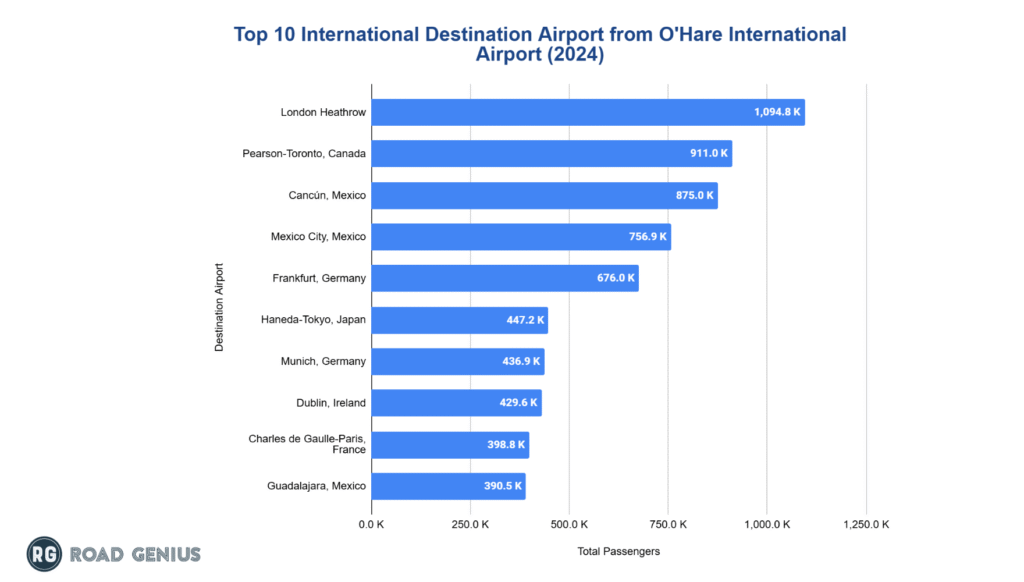
International Destinations
- London, United Kingdom (LHR), with 1.09 million passengers, was the most popular international destination from O’Hare International Airport (ORD) in 2024.
- Pearson-Toronto, Canada (YYZ) and Cancún, Mexico (CUN) follow with 910,966 and 875,047 passengers, respectively.
- Mexico City, Mexico (756,872) and Frankfurt, Germany (675,967) complete the top five international destinations.
How much cargo does O’Hare International Airport handle annually?
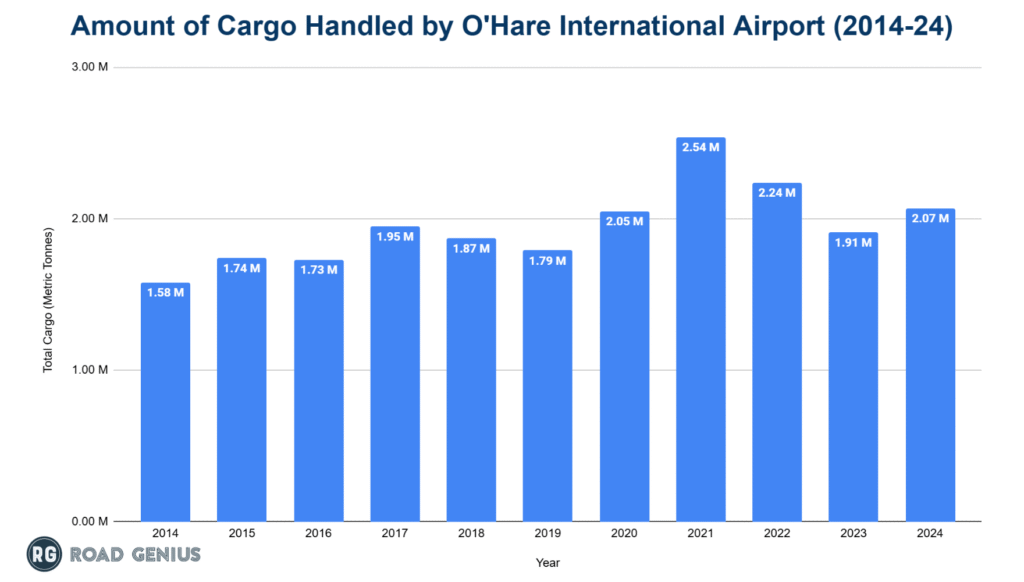
O’Hare processes over 2 million metric tons of cargo annually, positioning it as the sixth-busiest cargo airport in North America by tonnage while ranking first by cargo value.
- ORD processed 2.07 million metric tons of cargo in 2024, ranking sixth in North America by tonnage and first by cargo value.
- Volumes were 1.91 million metric tons in 2023 and 2.24 million in 2022.
- The airport reached a record 2.54 million metric tons in 2021.
Delays and Cancellations at O’Hare
- On‑time departures: 77% in 2024 (79% in 2023)
- On‑time arrivals: 78% in 2024 (79% in 2023)
- Cancellation rate: 1.35%, up from 1.22% in 2023
- Average departure delay: 76.4 minutes (71.4 minutes in 2023)
- Average arrival delay: 80.5 minutes (78.2 minutes in 2023)
What is the total annual operating revenue generated at O’Hare International Airport?
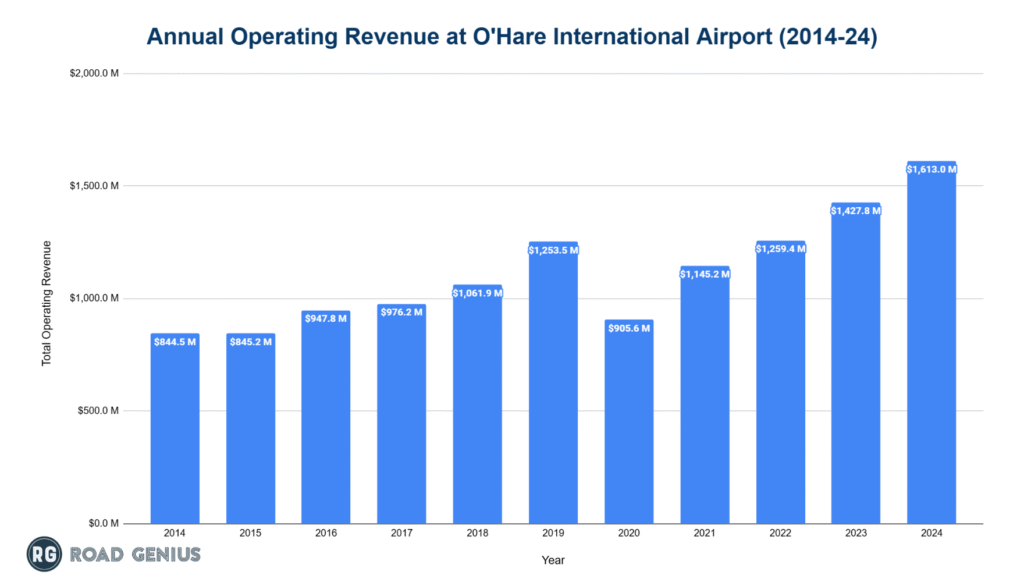
O’Hare international airport generates over $1 billion in operating revenue annually.
- The total annual operating revenue generated at O’Hare International Airport has steadily increased over the years, reaching $1.61 billion in 2024.
- This marks a rise from $1.43 billion in 2023 and $1.26 billion in 2022, recovering strongly from $905.6 million in 2020 during the pandemic.
- Compared to $1.15 billion in 2021 and $1.25 billion in 2019, the 2024 revenue reflects consistent post-pandemic growth.
What are the notable airport incidents at O’Hare?
- On September 17, 1961, Northwest Orient Airlines Flight 706 crashed on takeoff, killing all 37 aboard.
- On August 16, 1965, United Airlines Flight 389 crashed into Lake Michigan near O’Hare, killing all 30 on board.
- On December 27, 1968, North Central Airlines Flight 458 crashed into a hangar at O’Hare, killing 28 people.
- On December 20, 1972, North Central Flight 575 collided with Delta Flight 954 during takeoff, killing 10 passengers.
- On May 25, 1979, American Airlines Flight 191 crashed shortly after takeoff, killing 273 people—the deadliest single-aircraft crash in U.S. history.
- On March 19, 1982, a U.S. Air Force KC-135 crashed near Woodstock during approach, killing all 27 on board.
- On February 9, 1998, American Airlines Flight 1340 crashed while landing, injuring 22 passengers.
- On July 23, 2006, a near miss occurred between United Flight 1015 and Atlas Air Flight 6972; all 131 aboard survived.
- On October 28, 2016, American Airlines Flight 383 aborted takeoff due to an engine fire, injuring 21 people.
- On June 13, 2022, extreme turbulence during the landing of American Flight 151 injured a passenger not wearing a seatbelt; a lawsuit followed in 2024.
How many car rental brands operate at Chicago O’Hare Airport?
- 11 rental car brands operate at Chicago O’Hare Airport, with a total of over 14 car rental suppliers across Chicago.
What is the average cost of renting a car at Chicago O’Hare Airport?
- On average, car rentals at Chicago O’Hare Airport cost around $50 per day, with the lowest-priced rentals available from $4 per day.
Chicago Travel Resources
- Chicago RV rentals
- Car hire prices in Chicago
- Chicago to Indianapolis Car Rentals
- Chicago to Los Angeles Car Rentals
- Chicago to New Orleans Car Rentals
- Chicago to New York Car Rentals
- Chicago to Toronto Car Rentals
Other US Airport Statistics
- Dallas Fort Worth International Airport
- Denver International Airport
- Hartsfield–Jackson Atlanta International Airport
- Los Angeles International Airport
America & USA Travel Statistics Resources
- Arizona Statistics
- California Statistics
- Canada Statistics
- Chicago Statistics
- Colorado Statistics
- Florida Statistics
- Georgia Statistics
- Hawaii Statistics
- Illinois Statistics
- Louisiana Statistics
- Massachusetts Statistics
- Mexico Statistics
- Nevada Statistics
- New York Statistics
- Panama Statistics
- Peru Statistics
- South Dakota Statistics
- Tennessee Statistics
- Texas Statistics
- Utah Statistics
- Washington Statistics
