Page last updated: 4 March 2026
San Francisco International Airport (SFO) remains the Bay Area’s primary air gateway. By passenger count it is California’s second-busiest airport and ranks 13th in the United States.
How many passengers pass through San Francisco International Airport each year?
San Francisco International Airport handles over 50 million passengers annually, excluding the pandemic and recovery periods.
- SFO handled 54.53 million passengers in 2025, representing a 4.3% increase from 52.29 million in 2024, while still below the prepandemic level of 2018 and 2019.
- The airport reached its pre-pandemic peak in 2019 with 57.49 million travelers.
- Traffic dropped to 16.42 million in 2020 and 24.96 million in 2021 during the pandemic, then climbed to 42.28 million in 2022 before reaching 50.20 million in 2023.

International Passenger vs Domestic Passenger
Domestic travel still dominates SFO’s traffic mix, yet the international share is growing quickly.
- International passengers: 15.91 million in 2025, 29.3% of total traffic, up 1% YoY
- Domestic passengers: 38.45 million in 2025, 70.7% of total traffic, up 5.7% YoY

Enplaned vs Deplaned Passengers
San Francisco International Airport shows an almost equal number of enplaned and deplaned passengers, a characteristic common to major transit hubs.
- In 2025, the airport saw 27.25 million enplaned passengers, a 4.6% rise from 26.05 million in 2024. Of these, 19.3 million traveled within the U.S., while 7.95 million flew internationally.
- The airport deplaned 27.11 million passengers in 2025, up 3.9% from 26.08 million in the previous year. This included 19.14 million domestic travelers and 7.97 million international arrivals.
Passenger Flow at SFO: Enplaned vs Deplaned (2019-2025)
| Year | Domestic Enplaned (in Millions) | International Enplaned (in Millions) | Domestic Deplaned (in Millions) | International Deplaned (in Millions) |
| 2019 | 21.12 | 7.55 | 20.99 | 7.69 |
| 2020 | 6.57 | 1.61 | 6.55 | 1.68 |
| 2021 | 10.55 | 1.61 | 10.44 | 1.72 |
| 2022 | 16.07 | 4.98 | 16.13 | 4.96 |
| 2023 | 17.99 | 7.00 | 18.00 | 7.07 |
| 2024 | 18.20 | 7.85 | 18.17 | 7.91 |
| 2025 | 19.30 | 7.95 | 19.14 | 7.97 |
Aircraft Operations at San Francisco International Airport
San Francisco International Airport records over 300,000 aircraft operations (takeoffs and landings) each year.
- SFO recorded 416,288 aircraft operations in 2025, up 7.7% from 386,507 in 2024 and 8.2% from 384,871 in 2023.
- Operations peaked at 470,080 in 2018, fell to 229,568 in 2020 and have risen gradually since, reaching 265,597 in 2021 and 355,006 in 2022.

Aircraft Operations by Type
- The majority of aircraft movements at SFO in 2025 were conducted by commercial air carriers (380,130 operations).
- Air taxis contributed 26,705 movements, while general aviation recorded 7,313 operations.
- Military flights were the least frequent (2,140 operations).
Aircraft Operations at SFO International Airport by Type (2019-2025)
| Year | Air Carrier | Air Taxi | General Aviation | Military |
| 2019 | 393,869 | 50,917 | 10,999 | 2,711 |
| 2020 | 193,723 | 29,375 | 5,311 | 2,754 |
| 2021 | 215,767 | 39,660 | 7,237 | 2,933 |
| 2022 | 301,828 | 41,217 | 9,033 | 2,928 |
| 2023 | 346,766 | 28,312 | 7,080 | 2,713 |
| 2024 | 355,510 | 21,664 | 6,670 | 2,663 |
| 2025 | 380,130 | 26,705 | 7,313 | 2,140 |
Note: Air taxi operations refer to on-demand commercial flights using small aircraft and are classified under general aviation, which includes all non-scheduled civil aviation activities outside commercial airline services.
Top Airlines Operating out of San Francisco International Airport
United Airlines maintains a dominant position, using SFO as a fortress hub.
- United Airlines handled 24.31 million passengers in 2025 (43.8% market share), handling the largest portion of passenger traffic and maintaining its position as the dominant carrier
- Skywest Airlines and Delta Airlines followed with 4.15 million and 4.03 million passengers, each holding 7.5% and 7.3% market share.
- American Airlines served 3.56 million passengers (6.4%), and Alaska Airlines handled 3.32 million passengers (6.0%), rounding out the top five airlines by passenger volume.
Top 10 Airlines at SFO Airport by Passenger Volume (2025)
| Airline | Total Passenger (in Millions) | Market Share |
| United Airlines | 24.31 | 44.6% |
| SkyWest Airlines | 4.15 | 7.6% |
| Delta Air Lines | 4.03 | 7.4% |
| American Airlines | 3.56 | 6.5% |
| Alaska Airlines | 3.32 | 6.1% |
| Southwest Airlines | 2.23 | 4.1% |
| Frontier Airlines | 1.27 | 2.3% |
| JetBlue Airways | 1.18 | 2.2% |
| Air Canada | 0.73 | 1.3% |
| EVA Airways | 0.54 | 1.0% |
Monthly Trends in Passenger Traffic at San Francisco International Airport
San Francisco International Airport shows clear seasonal trends in passenger traffic and peak volumes occur during the summer months.
- The busiest month in 2025 was July (5.28 million passengers), followed closely by June (5.13 million) and May (4.87 million).
- August (4.84 million) and December (4.56 million) also saw high volumes, indicating steady spring and fall travel.
- In contrast, January (4.03 million) and February (3.55 million) were the least busy months

Most Popular Destinations out of San Francisco International Airport
Domestic Destinations
- Los Angeles (LAX) was the top domestic destination in 2024, attracting 1.36 million passengers.
- Chicago (ORD) came next (936,990 travelers), followed by New York (JFK) with 898,350 passengers.
- Denver (DEN) recorded 870,190 and Newark (EWR) 801,320 passengers.

International Destinations
- In 2024, San Francisco International Airport (SFO)’s top international destination was Taipei, Taiwan (SJD), recording 1.36 million passengers.
- London, United Kingdom (LHR) was the destination for 1.08 million travelers, and Vancouver, Canada for 817,103 passengers.
- The top five international destinations were completed by Incheon-Seoul, South Korea (700,297), and Frankfurt, Germany (636,217).

San Francisco Travel Resources
- San Francisco RV rentals
- Car hire prices in San Francisco
- EV Charging Station in San Francisco
- San Francisco to Las Vegas Car Rentals
- San Francisco to Los Angeles Car Rentals
- San Francisco to Portland Car Rentals
- San Francisco to San Diego Car Rentals
- San Francisco to Seattle Car Rentals
How much cargo does San Francisco International Airport handle annually?
San Francisco International Airport handles around 500,000 metric tons of cargo each year.
- SFO handled 537,115 metric tons of cargo in 2025, down 4.5% from 562,151 in 2024 but above 484,100 in 2023.
- Before the pandemic the airport managed 546,437 metric tons of cargo in 2019.
- Cargo volume dipped to 439,358 metric tons in 2020, rebounded to 528,944 metric tons in 2021.

How many delays and cancellations occurred at San Francisco International Airport in the last year?
- On-time departures: 75% in 2024 (down from 79% in 2023)
- On-time arrivals: 69% in 2024 (down from 76% in 2023)
- Flight cancellations: 1.33% in 2024 vs 1.08% in 2023 (9th-lowest among U.S. airports)
- Average departure delay: 69.76 minutes in 2024, up slightly from 67.98 minutes
- Average arrival delay: 66.36 minutes in 2024, an improvement from 69.56 minutes
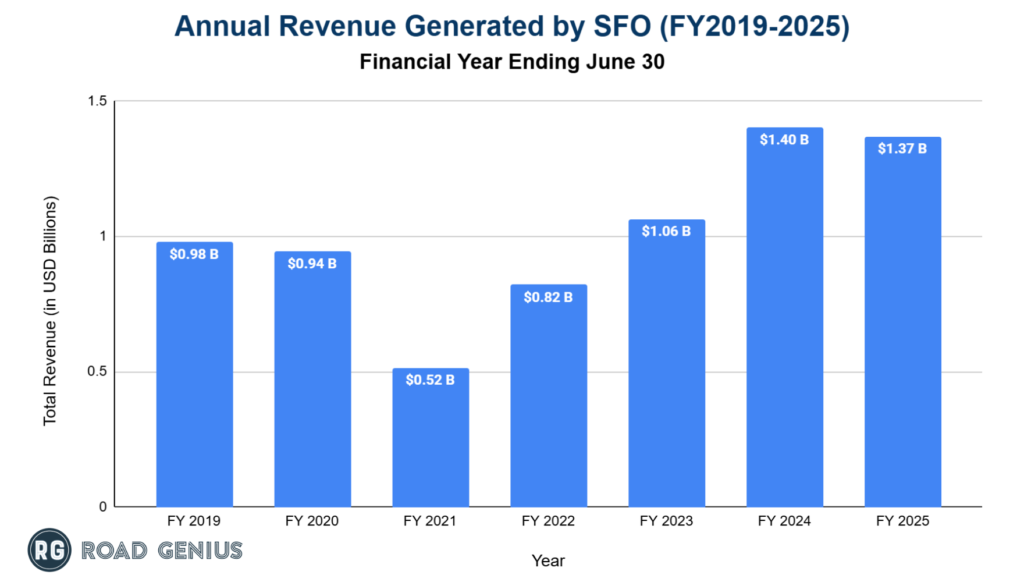
How much revenue has San Francisco International Airport generated each year?
San Francisco International Airport (SFO) has experienced growth in total revenue over the years, surpassing the $1 billion mark consistently since 2022.
- SFO generated $1.37 billion in revenue in 2025, down 2.3% from $1.40 billion in FY 2024.
- The airport’s revenue experienced a dip during the pandemic, falling from $980.4 million in FY 2019 to $943.9 million in FY 2020 and $515.4 million in FY 2021.
- Revenue rebounded to $821.3 million in FY 2022 and $1.06 billion in FY 2023.
Major Incidents at San Francisco International Airport
- Sept 11 2001: United Flight 93, bound for San Francisco, was hijacked and crashed in Pennsylvania after passengers intervened.
- May 26 2007: A SkyWest plane almost collided with a Republic jet on intersecting runways due to a clearance error.
- Jun 28 2008: An ABX Air cargo jet caught fire before takeoff; the pilots escaped.
- Sept 22 2012: A catering truck struck a parked jet’s wing, killing the driver.
- Jul 6 2013: Asiana Flight 214 crashed on landing because of pilot error, killing three people.
- Jul 7 2017: Air Canada Flight 759 nearly landed on a taxiway lined with planes before executing a go-around.
- Oct 22 2017: Air Canada Flight 781 landed without ATC contact after a radio mix-up.
- Mar 7 2024: A United 777 lost a wheel after takeoff, damaging cars on the ground and injuring a ground worker; the aircraft landed safely.
Other US Airport Statistics
- Charlotte Douglas International Airport Statistics
- Dallas Fort Worth International Airport
- Denver International Airport
- Harry Reid International Airport (LAS)
- Hartsfield–Jackson Atlanta International Airport
- John F. Kennedy International Airport Statistics
- Los Angeles International Airport
- Miami International Airport
- Orlando International Airport (MCO)
- O’Hare International Airport Statistics
- Phoenix Sky Harbor International Airport Statistics
- Seattle-Tacoma International Airport Statistics
USA Travel Statistics Resources
- Arizona Statistics (incl. Grand Canyon National Park)
- California Statistics (incl. Los Angeles, San Diego, San Francisco, Universal Studios Hollywood)
- Florida Statistics (incl. Destin, Key West, Miami, Orlando, Universal Orlando, Walt Disney World)
- Hawaii Statistics (incl. Kauai, Maui, Oahu)
- Illinois Statistics (incl. Chicago)
- Louisiana Statistics (incl. New Orleans)
- Massachusetts Statistics (incl. Boston)
- Nevada Statistics (incl. Las Vegas)
- New York Statistics (incl. New York City, Statue of Liberty)
- South Dakota Statistics (incl. Mount Rushmore)
- Tennessee Statistics (incl. Memphis, Nashville)
- Texas Statistics (incl. Dallas, Houston, San Antonio)
- Utah Statistics
- Washington Statistics (incl. Seattle)
- Yellowstone National Park Statistics
References
- FSFO: San Francisco International Airport Air Traffic Statistics
- DT: International Destination of Passenger from San Francisco International Airport
- BTS: Top Domestic Destination of Passenger from San Francisco International Airport and On-Time Performance Summary
- NTSB: San Francisco International Airport Incident Information