Page last updated: 4 March 2026
Detroit Metropolitan Wayne County Airport (DTW) is a key North American hub and Delta Air Lines’ second-largest base, handling more than 32 million passengers a year while posting one of the world’s best on-time records.
How many passengers pass through Detroit Metropolitan Airport each year?
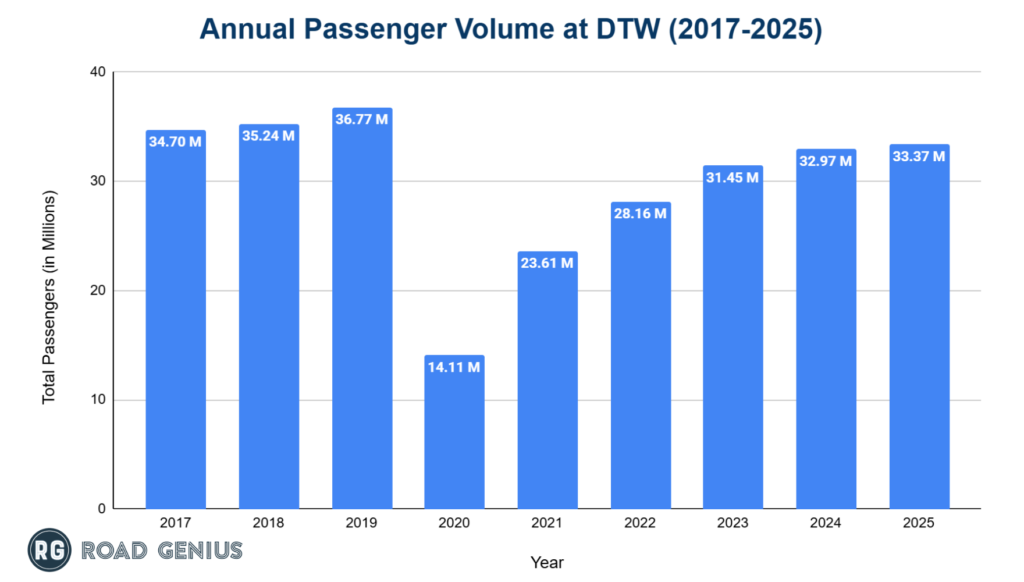
Detroit Metropolitan Airport handles over 30 million passengers annually, excluding the pandemic and recovery periods.
- DTW moved 33.37 million passengers in 2025, up 1.2 % from 32.97 million in 2024.
- Traffic peaked in 2019 at 36.77 million before pandemic disruptions cut volume to 14.11 million in 2020.
- Recovery was steady, climbing to 23.61 million in 2021 and 28.16 million in 2022 and reaching 32.45 million by 2023.
International Passenger vs Domestic Passenger
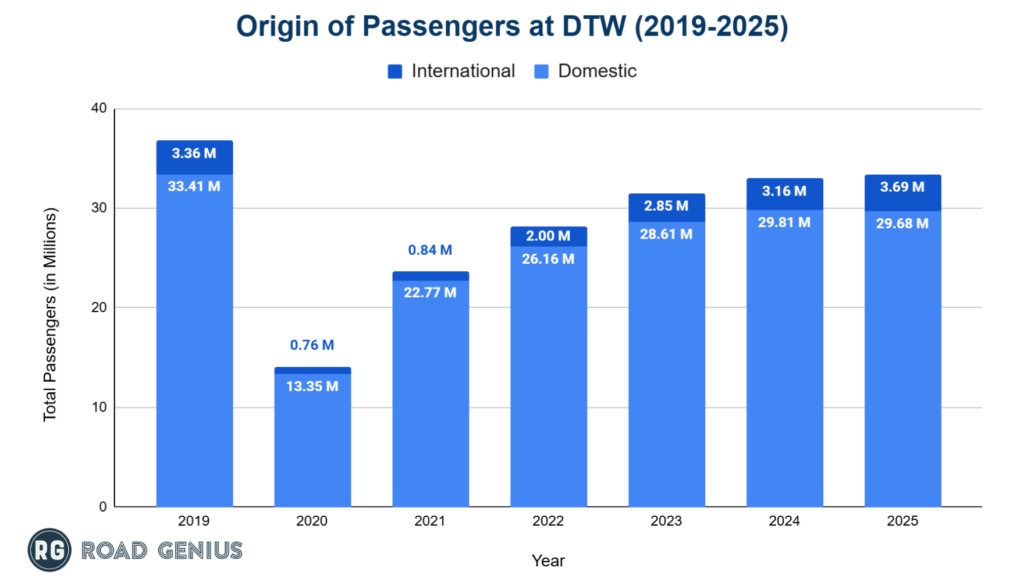
DDTW remains heavily domestic, although international traffic is bouncing back faster.
- Domestic passengers 2025: 29.68 million (88.9% of total)
- International passengers 2025: 3.69 million (11.1% of total)
The 2019 baseline was 33.41 million domestic travelers (90.9%) and 3.36 million international (9.1%).
Enplaned Passenger vs Deplaned Passenger
Detroit Metropolitan Airport (DTW) exhibits a balanced flow of passenger traffic, typical for a major hub.
- DTW recorded 16.66 million enplaned passengers in 2025, reflecting a 1.3% increase from 16.45 million in 2024.
- Similarly, deplaned passengers rose to 16.71 million, a 1.1% rise compared to 16.52 million the previous year.
Passenger Flow at DTW: Enplaned vs Deplaned (2019-2025)
| Year | Enplaned Passengers (in Millions) | Deplaned Passengers (in Millions) |
| 2019 | 18.36 | 18.41 |
| 2020 | 7.03 | 7.08 |
| 2021 | 11.78 | 11.83 |
| 2022 | 14.05 | 14.11 |
| 2023 | 15.70 | 15.75 |
| 2024 | 16.45 | 16.52 |
| 2025 | 16.66 | 16.71 |
What is the total number of aircraft operations at Detroit Metropolitan Airport each year?
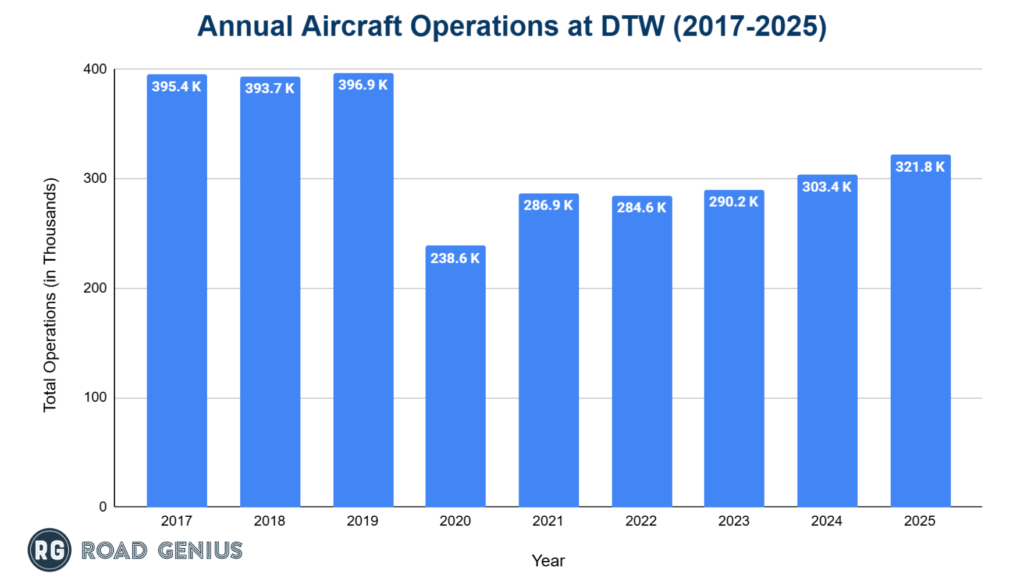
Detroit Metropolitan Airport records over 300,000 total aircraft operations annually.
- DTW logged 321,759 takeoffs and landings in 2025, a 6.0% rise from 303,441 in 2024.
- Operations hit 396,909 in 2019 then fell to 238,574 in 2020, climbing to 286,909 in 2021, before dipping to 284,606 in 2022 and rebounding to 290,238 in 2023.
Aircraft Operations by Type
- Detroit Metropolitan Airport saw most of its aircraft operations handled by commercial air carriers in 2025, which completed 312,548 flights.
- Air taxi operations made up 4,530 movements, and general aviation activity totaled 4,613 movements.
- Military flights were the least common, with just 68 recorded operations.
Aircraft Operations at Detroit Metropolitan Airport by Type (2019-2025)
| Year | Air Carrier | Air Taxi | General Aviation | Military |
| 2019 | 328,192 | 62,856 | 5,772 | 89 |
| 2020 | 197,719 | 36,918 | 3,815 | 122 |
| 2021 | 239,953 | 42,240 | 4,616 | 100 |
| 2022 | 248,170 | 31,613 | 4,693 | 130 |
| 2023 | 276,001 | 9,622 | 4,535 | 80 |
| 2024 | 293,696 | 4,453 | 5,045 | 247 |
| 2025 | 312,548 | 4,530 | 4,613 | 68 |
Note: Air taxi operations refer to on-demand commercial flights using small aircraft and are classified under general aviation, which includes all non-scheduled civil aviation activities outside commercial airline services.
Which is the busiest terminal at Detroit Metropolitan Airport?
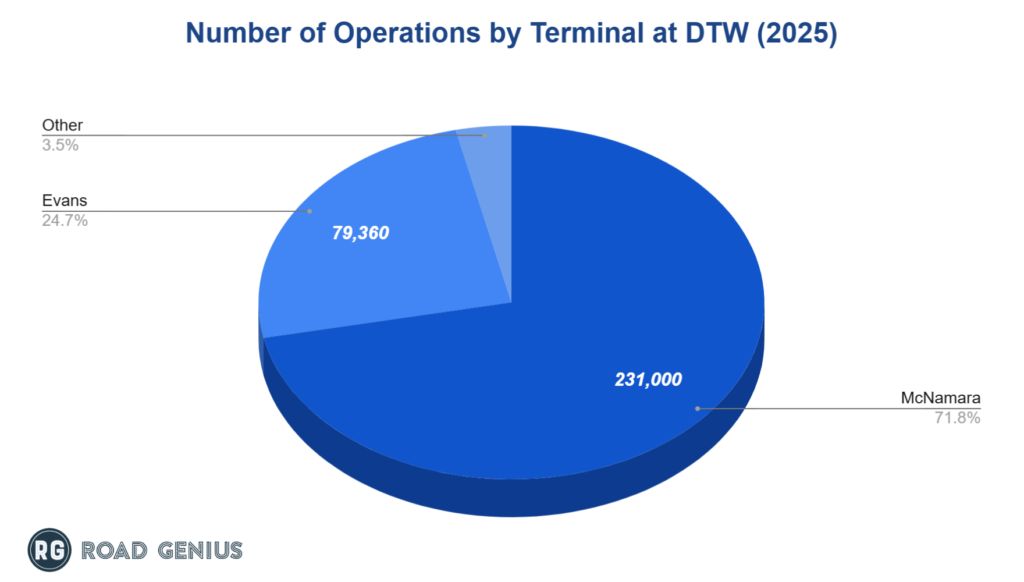
McNamara terminal is the busiest terminal at Detroit Metropolitan Airport.
- McNamara terminal at DTW handled 231,000 operations in 2025, making it the busiest terminal.
- In comparison, Evans terminal recorded 79,360 operations.
Which airlines operate the most flights out of Detroit Metropolitan Airport?
Delta Air Lines dominates DTW as its second-largest global hub, while Spirit Airlines provides a major low-cost option.
- Delta Airlines led aircraft operations at Detroit Metropolitan Airport in 2025, recording 228,556 movements, far surpassing other carriers.
- Spirit Airlines followed with 23,554 operations, while American Airlines conducted 19,380 flights.
- United Airlines reported 13,646 operations, and Southwest Airlines completed the top 5, with 8,480 recorded movements.
Top 10 Airlines at DTW Airport by Total Operations (2025)
| Airline | Total Operations | Market Share |
| Delta Airlines | 228,556 | 71.0% |
| Spirit Airlines | 23,554 | 7.3% |
| American Airlines | 19,380 | 6.0% |
| United Airlines | 13,646 | 4.2% |
| Southwest Airlines | 8,480 | 2.6% |
| Frontier Airlines | 4,520 | 1.4% |
| JetBlue Airways | 2,200 | 0.7% |
| Air Canada | 1,680 | 0.5% |
| Aeromexico | 1,146 | 0.4% |
| Alaska Airlines | 1,076 | 0.3% |
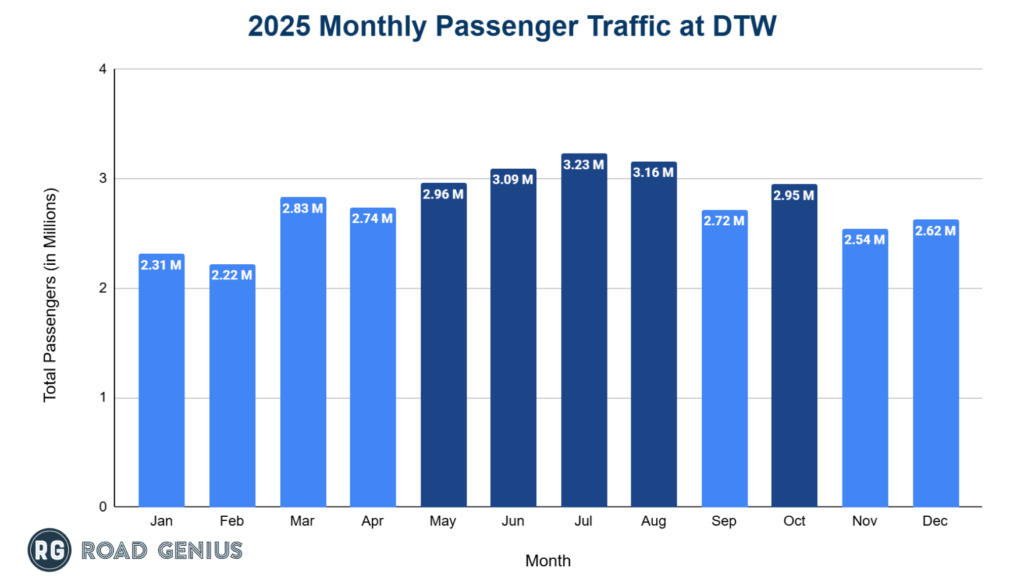
What are the monthly trends in passenger traffic at Detroit Metropolitan Airport?
Passenger numbers follow a clear seasonal curve.
- July topped the chart in 2025 at 3.23 million travelers, closely trailed by August (3.16 million) and June (3.09 million).
- May posts 2.96 million, signaling robust late-spring demand.
- The quietest months are January (2.31 million) and February (2.22 million).
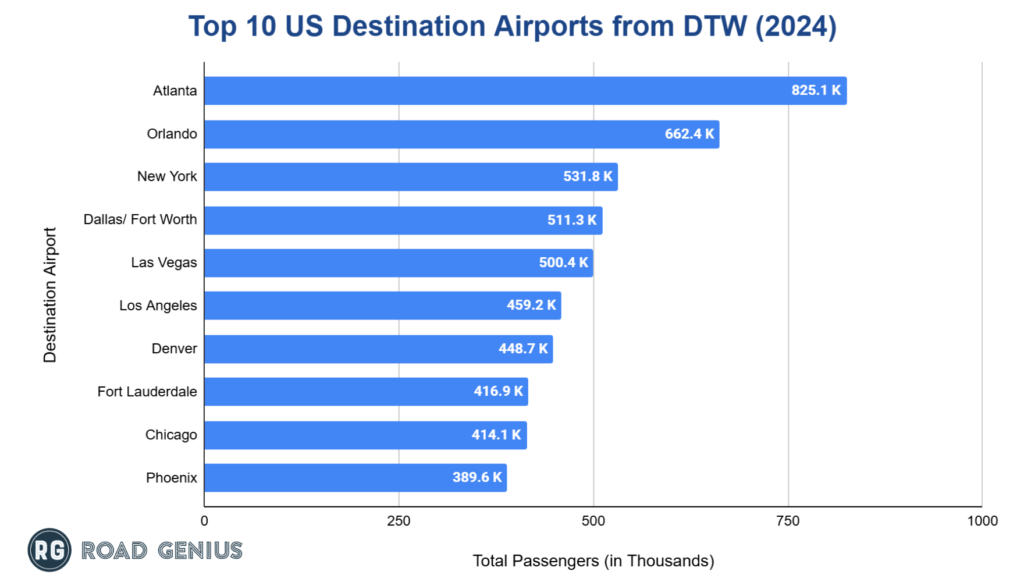
Which destinations are the most popular from Detroit Metropolitan Airport?
Domestic Destinations
- Atlanta (ATL) leads with approximately 825,070 annual passengers, serving as Delta’s primary hub connection.
- Orlando (MCO) follows with around 662,360 passengers.
- New York (LGA) ranks third with approximately 531,840 passengers.
- Dallas/ Fort Worth (DFW) and Las Vegas (LAS) complete the top five with approximately 511,310 and 500,430 passengers respectively.
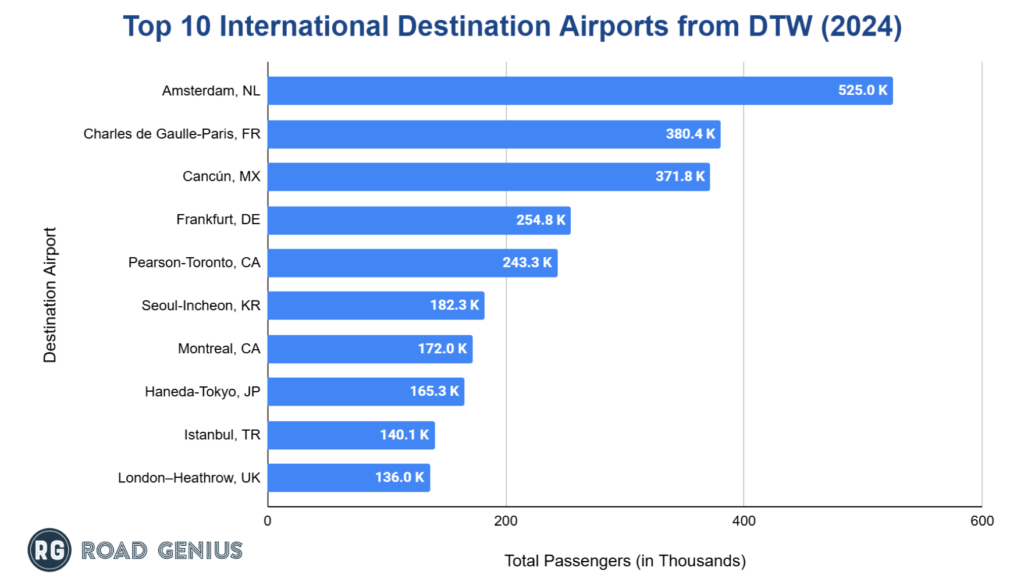
International Destinations
- In 2024, the leading international destination from DTW was Amsterdam, Netherlands (AMS), with 525,024 passengers.
- Paris’s Charles de Gaulle Airport (CDG) ranked second, serving 388,366 travelers, while Cancún, Mexico, came in third with 371,780 passengers.
- Rounding out the top five were Frankfurt, Germany, with 254,788 passengers, and Toronto Pearson Airport in Canada, with 243,298 passengers.
Detroit Travel Resources
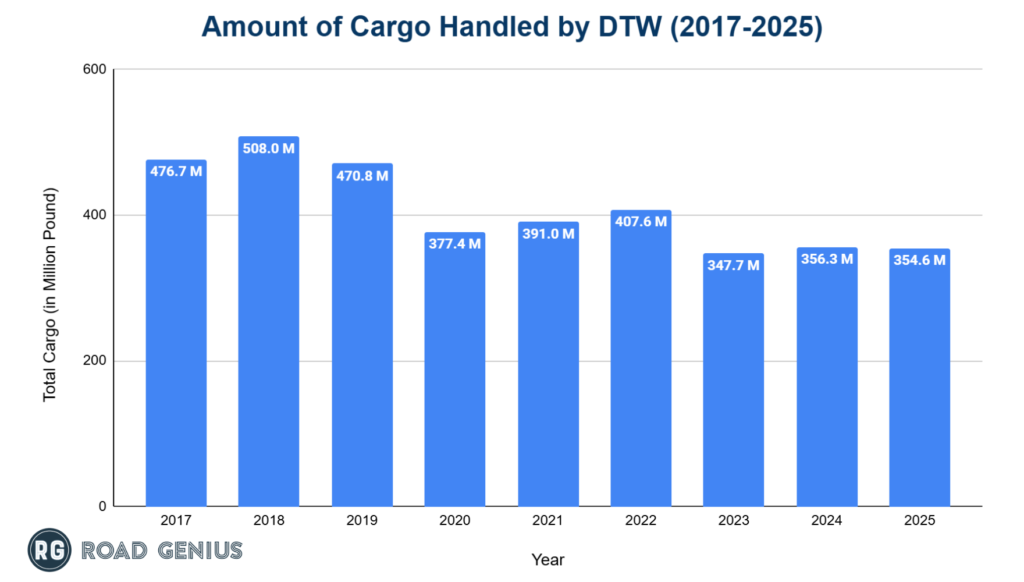
How much cargo does Detroit Metropolitan Airport handle annually?
Detroit Metropolitan Airport handles over 350 million pounds of cargo each year.
- DTW moved 354.6 million lb of cargo in 2025.
- Pre-pandemic volume reached 470.8 million lb in 2019, then dropped to 377.4 million lb in 2020.
- Cargo recovered to 391.0 million lb in 2021 and 407.6 million lb in 2022, slid to 347.7 million lb in 2023, then ticked up again to 356.3 million lb in 2024.
How many delays or cancellations occurred at Detroit Metropolitan Airport?
- In 2024 DTW’s on-time departure rate slipped to 81 % from 82 % in 2023.
- On-time arrivals also fell to 81 % from 83 %.
- Average departure delay lengthened to 75.23 minutes from 70.93 minutes, while arrival delays increased to 79.99 minutes from 77.87 minutes.
- The cancellation rate improved, dropping to 1.03 % from 1.17 %.
How much revenue has been generated at the airport each year?
DTW earns over $350 million in operating revenue annually.
- Operating revenues reached $393.2 million in 2024, approaching the pre-pandemic peak of $396.7 million in 2019
- During the 2020 pandemic impact, revenues declined by a relatively modest 34.9% to $258.2 million despite passenger traffic falling by 61.6%
- Revenue recovery has been steady, climbing from $336.4 million in 2021 to $351.9 million in 2022 and $386.8 million in 2023.
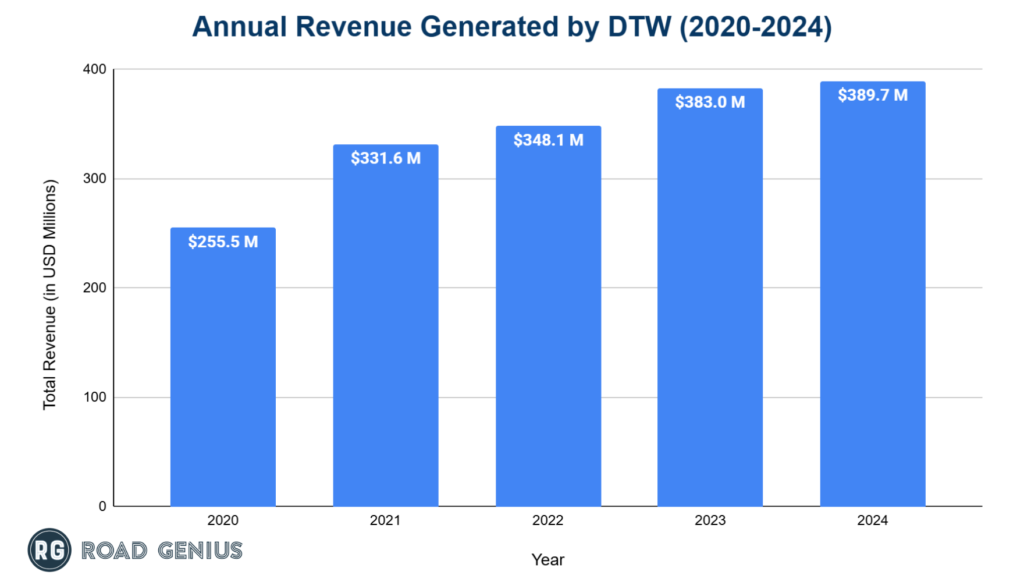
Note: 2025 revenue data for Detroit Metropolitan Airport is not available yet
What major incidents have occurred at Detroit Metropolitan Airport?
- Jan 11 1983: United Airlines Flight 2885 crashed after takeoff due to a mistrimmed stabilizer, killing all three crew.
- Mar 4 1987: Northwest Airlink Flight 2268 crashed on landing, striking ground vehicles and catching fire, nine fatalities.
- Aug 16 1987: Northwest Airlines Flight 255 crashed on takeoff when flaps were not deployed, one survivor.
- Dec 3 1990: Northwest Flight 1482 collided with another aircraft on the runway, eight deaths.
- Jan 9 1997: Comair Flight 3272 crashed on approach in icing conditions, 29 fatalities, tied to inadequate FAA standards.
- Mar 17 2001: Northwest Flight 985 skidded off the runway after a trim misconfiguration aborted takeoff, all 151 survived.
- Dec 25 2009: A passenger attempted to bomb Northwest Flight 253 on approach to Detroit, injuring four.
Other US Airport Statistics
- Charlotte Douglas International Airport Statistics
- Dallas Fort Worth International Airport
- Denver International Airport
- Harry Reid International Airport (LAS)
- Hartsfield–Jackson Atlanta International Airport
- John F. Kennedy International Airport Statistics
- Los Angeles International Airport
- Miami International Airport
- Orlando International Airport (MCO)
- O’Hare International Airport Statistics
- Phoenix Sky Harbor International Airport Statistics
- San Francisco International Airport Statistics
- Seattle-Tacoma International Airport Statistics
USA Travel Statistics Resources
- Arizona Statistics (incl. Grand Canyon National Park)
- California Statistics (incl. Los Angeles, San Diego, San Francisco, Universal Studios Hollywood)
- Florida Statistics (incl. Destin, Key West, Miami, Orlando, Universal Orlando, Walt Disney World)
- Hawaii Statistics (incl. Kauai, Maui, Oahu)
- Illinois Statistics (incl. Chicago)
- Louisiana Statistics (incl. New Orleans)
- Massachusetts Statistics (incl. Boston)
- Nevada Statistics (incl. Las Vegas)
- New York Statistics (incl. New York City, Statue of Liberty)
- South Dakota Statistics (incl. Mount Rushmore)
- Tennessee Statistics (incl. Memphis, Nashville)
- Texas Statistics (incl. Dallas, Houston, San Antonio)
- Utah Statistics
- Washington Statistics (incl. Seattle)
- Yellowstone National Park Statistics
References
- DMA: Detroit Metropolitan Airport Aviation Statistics and Financial Information
- DT: International Destination of Passenger from Detroit Metropolitan Airport
- BTS: Top Domestic Destination of Passenger from Detroit Metropolitan Airport and On-Time Performance Summary
- NTSB: Detroit Metropolitan Airport Incident Information