Page last updated: 19 December 2025
Global tourism achieved full post‑pandemic recovery in 2024, with international arrivals back to 2019 levels and receipts at record highs. In 2025 year-to-date, arrivals are trending above 2024 and receipts continue to grow.
Global Tourism Performance Summary (2025 Year-to-Date)
January – September 2025 Actuals:
- International arrivals (first 9 months): 1.16 billion visitors
- Growth vs 2024: +4.5% YOY
- Comparison to 2019: +3.2% above the same period in 2019
- Tourism receipts (9 months): $1.35 trillion
- Average spending per tourist: $1,174 per visitor
- Leading growth region: Africa (+12% YoY)
| Monthly Tourism Performance 2025 & 2024 | ||
| Month | 2025 Arrivals (million) | 2024 Arrivals (million) |
| January | 80 | 71 |
| February | 70 | 67 |
| March | 100 | 99 |
| April | 130 | 117 |
| May | 150 | 145 |
| June | 160 | 156 |
| July | 175 | 169 |
| August | 170 | 166 |
| September | 130 | 125 |
| October | Not Available | 120 |
| November | Not Available | 100 |
| December | Not Available | 135 |
Note: This data is preliminary and subject to change once all information is available and finalized.
Global Tourism Overview Summary (2024)
- Total international arrivals: 1.47 billion (100% of 2019 levels)
- Total tourism receipts: USD $1.734 trillion (record high)
- Tourism GDP contribution: $10.9 trillion (10% of global GDP)
- Employment supported: 357 million jobs (1 in 10 jobs globally)
- Fastest recovering region: Middle East (132% of 2019 levels)
- Recovery status: Full recovery achieved globally; 2025 projected to exceed 2019
How many international tourists travel globally each year?
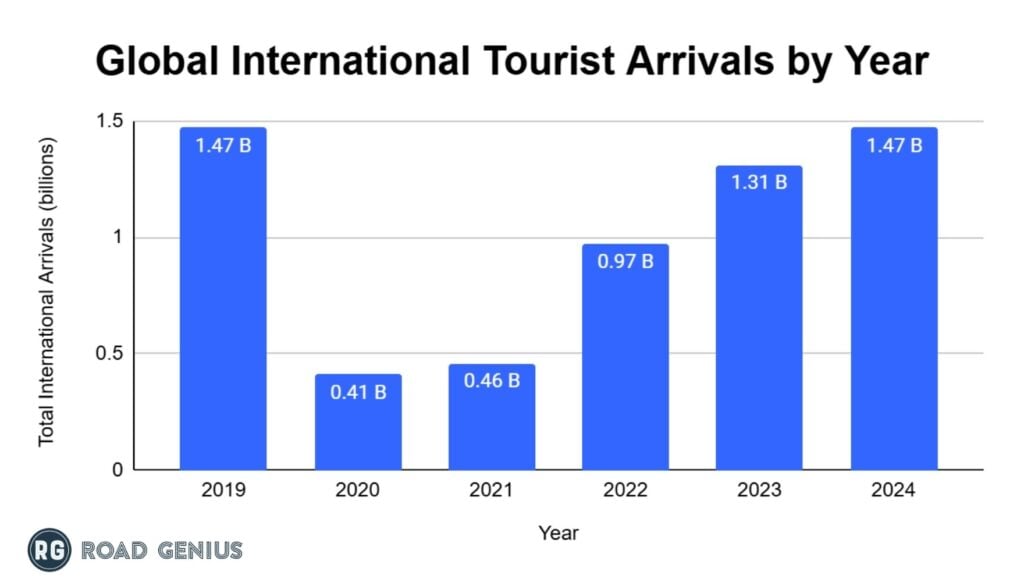
Over 1.4 billion international tourists have traveled globally in recent years.
- In 2024, the world welcomed 1.47 billion international arrivals, a 12.2% increase from 2023.
- Visitor numbers reached 1.31 billion in 2023, up from 976 million in 2022.
- 1.47 billion tourists traveled internationally in 2019, which collapsed to 408 million in 2020 and 461 million in 2021 during the pandemic.
What are the top 10 most popular tourist destinations in the world?
France, Spain, and the United States are the leading destinations for international tourism. France maintained its position as the world’s most visited country, receiving 102 million international arrivals in 2024, making it the first country ever to surpass 100 million annual tourists.
- Spain placed 2nd among the top popular visiting countries, recording 93.8 million arrivals based on global tourism statistics.
- The United States ranked 3rd with 72.4 million visitors, according to international tourism data.
- Turkey secured 4th position in the top world destinations, reporting 60.6 million international arrivals.
- Italy ranked 5th with 57.8 million visitors, remaining one of the major global tourist destinations by total arrivals.

What is the number 1 tourist destination in the world?
France is the top tourist destination in the world, with 102 million visitors in 2024.
- Read more about Global Tourism Ranking – Most Visited Countries.
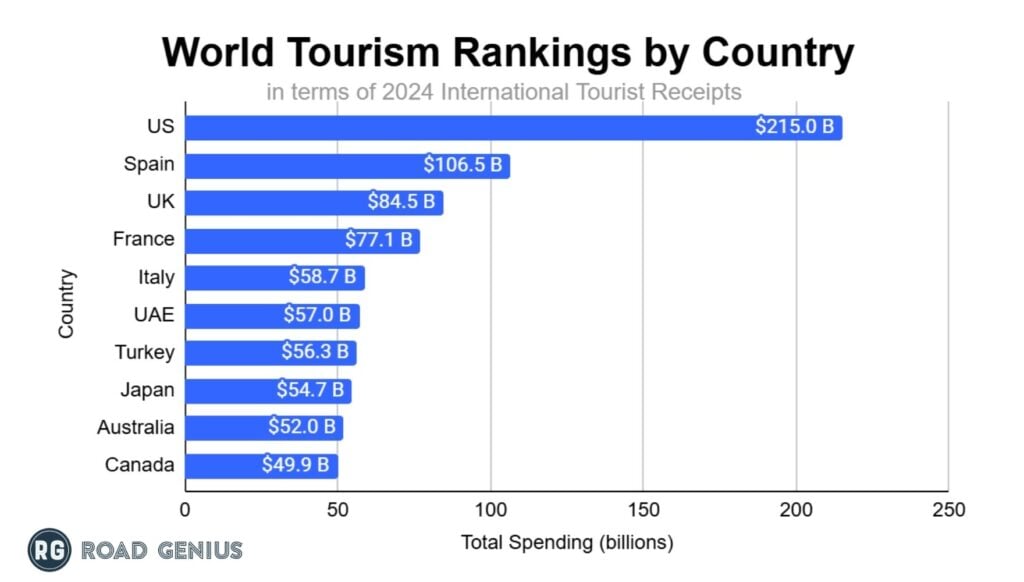
World Tourism Rankings by Country in Terms of Spending
The United States is the world’s top tourism earner, generating $215 billion in international tourism receipts in 2024.
- Spain ranked 2nd, earning $106.5 billion from global travelers.
- The United Kingdom placed 3rd with $84.5 billion in tourism spending.
- France followed in 4th position, recording $77.1 billion in receipts.
- Italy secured 5th place with $58.7 billion generated from international tourism.
Top 10 City Destinations for 2024
Bangkok is the most famous city in the world, welcoming 32.4 million international visitors in 2024. The top 10 most popular city destinations in terms of international arrivals for 2024 include:
- Bangkok, Thailand: 32.4 million arrivals (+37% vs 2023)
- Istanbul, Turkey: 23 million arrivals (+14% vs 2023)
- London, UK: 21.7 million arrivals (+7% vs 2023)
- Hong Kong SAR: 20.5 million arrivals (+19% vs 2023)
- Mecca, Saudi Arabia: 19.3 million arrivals (+20% vs 2023)
- Antalya, Turkey: 19.3 million arrivals (+17% vs 2023)
- Dubai, UAE: 18.2 million arrivals (+8% vs 2023)
- Macau SAR: 18 million arrivals (+26% vs 2023)
- Paris, France: 17.4 million arrivals (+2% vs 2023)
- Kuala Lumpur, Malaysia: 16.5 million arrivals (+73% vs 2023)
World Tourism Rankings by Country in Terms of Total Arrivals (2024)
| Rank | Country | Region | Arrivals (million) | Receipts (USD billion) | Receipts per arrival (USD) |
| 1 | France | Europe | 102 | $77.1 | $755 |
| 2 | Spain | Europe | 93.8 | $106.5 | $1,135 |
| 3 | United States | Americas | 72.4 | $215 | $2,970 |
| 4 | Turkey | Europe | 60.6 | $56.3 | $930 |
| 5 | Italy | Europe | 57.8 | $58.7 | $1,015 |
| 6 | Mexico | Americas | 45 | $28 | $620 |
| 7 | United Kingdom | Europe | 41.8 | $84.5 | $2,020 |
| 8 | Germany | Europe | 37.5 | $37.5 | $1,000 |
| 9 | Japan | Asia Pacific | 36.9 | $54.7 | $1,480 |
| 10 | Greece | Europe | 36 | $21.7 | $600 |
| 11 | Thailand | Asia Pacific | 35.5 | $50 | $1,400 |
| 12 | China (Mainland) | Asia Pacific | 30.5 | $40 | $1,300 |
| 13 | Austria | Europe | 26 | $23.5 | $905 |
| 14 | Saudi Arabia | Middle East | 29.7 | $25 | $1,350 |
| 15 | Hong Kong SAR | Asia Pacific | 20.5 | $38.9 | $1,900 |
| 16 | Malaysia | Asia Pacific | 19 | $14 | $735 |
| 17 | UAE | Middle East | 18.7 | $57 | $3,600 |
| 18 | Canada | Americas | 17.9 | $49.9 | $2,790 |
| 19 | Netherlands | Europe | 16.3 | $16.2 | $995 |
| 20 | Poland | Europe | 16.1 | $12.7 | $790 |
Travel Patterns: A Closer Look at the Most Travelled Countries Every Year
| Country | 2019 | 2020 | 2021 | 2022 | 2023 | 2024 |
| France | 90.91 M | 41.68 M | 48.40 M | 93.20 M | 100.0 M | 102.0 M |
| Spain | 83.51 M | 18.93 M | 31.18 M | 71.66 M | 85.17 M | 93.80 M |
| United States | 79.44 M | 19.21 M | 22.28 M | 50.87 M | 66.48 M | 72.40 M |
| Italy | 64.51 M | 25.19 M | 26.89 M | 49.81 M | 57.25 M | 57.80 M |
| Turkey | 51.19 M | 15.89 M | 29.93 M | 50.45 M | 55.16 M | 60.60 M |
| Mexico | 45.02 M | 24.82 M | 31.86 M | 38.33 M | 42.15 M | 45.00 M |
| United Kingdom | 39.42 M | 10.71 M | 6.29 M | 30.74 M | 37.22 M | 41.80 M |
| Germany | 39.56 M | 12.45 M | 11.69 M | 28.46 M | 34.80 M | 37.50 M |
| Greece | 31.35 M | 7.37 M | 14.71 M | 27.84 M | 32.74 M | 36.00 M |
| Japan | 32.00 M | 4.12 M | 0.25 M | 3.83 M | 25.07 M | 36.90 M |
| Austria | 31.88 M | 15.09 M | 12.73 M | 26.22 M | 30.91 M | 26.00 M |
| China | 65.73 M | 7.97 M | 5.66 M | – | – | 30.50 M |
Global Travel Resources
Rental prices
- Rent a car in Australia
- Rent a car in Canada
- Rent a car in France
- Rent a car in Germany
- Rent a car in Iceland
- Rent a car in Ireland
- Rent a car in Italy
- Rent a car in Japan
- Rent a car in New Zealand
- Rent a car in the Netherlands
- Rent a car in South Korea
- Rent a car in the USA
Campervan Rental
- Campervan rental Australia
- Campervan rental Canada
- Campervan rental France
- Campervan rental Germany
- Campervan rental Iceland
- Campervan rental Ireland
- Campervan rental Italy
- Campervan rental New Zealand
- Campervan rental Norway
- Campervan rental Scotland
- Campervan rental United Kingdom
- Campervan rental United States
Best Performing Region in Terms of Recovery
International tourism achieved 100% of its pre-pandemic figures in 2024, marking a complete recovery from the 28% observed in 2020, 31% in 2021, 66% in 2022, and 89% in 2023.
- The Middle East led the global recovery with international tourist arrivals reaching 132% of 2019 levels, the highest of any region. Saudi Arabia’s transformation drove this growth with arrivals increasing from 2019.
- Africa exceeded pre-pandemic levels at 107%, with Morocco leading at 135% of 2019 with 17.4 million visitors.
- Europe surpassed 2019 at 101% with 758.6 million arrivals, driven by strong performance in Spain, Turkey, and Greece.
- Americas nearly completed recovery at 97% expected to exceed 2019 in 2025 as the U.S. inbound market strengthens.
- Asia and the Pacific reached 87% of 2019 levels and is showing strong momentum, expected to fully recover in 2025 as China’s outbound tourism normalizes.
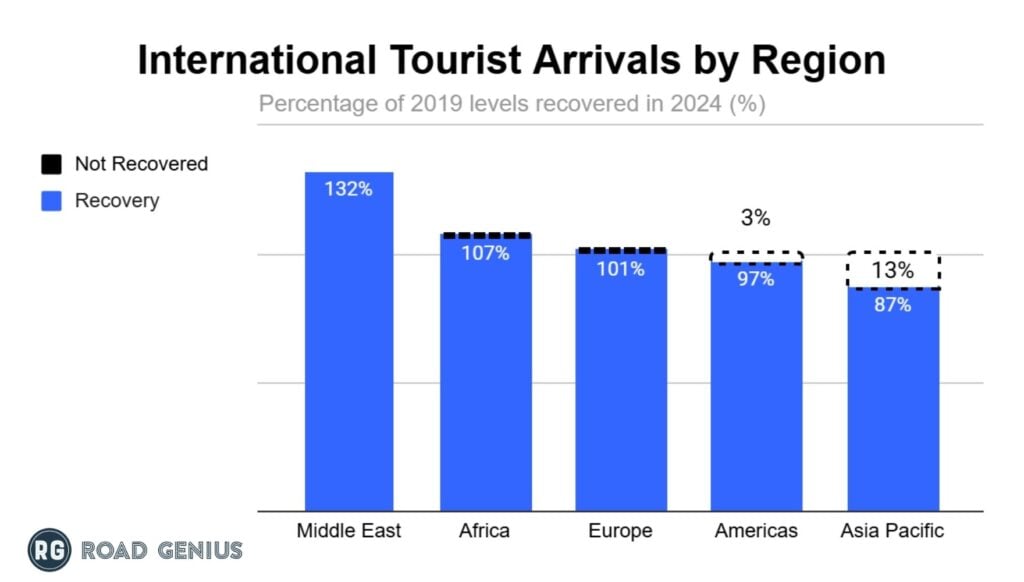
Recovery of International Tourist Arrivals by Region (2024)
(%) Result of 2024 compared to pre-pandemic 2019 levels.
Europe Tourism Ranking by Country
- Turkey: +18% (60.6M vs 51.2M in 2019)
- Greece: +15% (36M vs 31.3M in 2019)
- France: +12% (102M vs 90.9M in 2019)
- Serbia: +12% (2.3M vs 2M in 2019)
- Spain: +12% (93.8M vs 83.5M in 2019)
- Portugal: +10% (17.8M vs 16.2M in 2019)
- Montenegro: +10% (2.7M vs 2.5M in 2019)
- Denmark: +8% (13.5M vs 12.5M in 2019)
- Malta: +5% (3.2M vs 3M in 2019)
- Italy: -10% (57.8M vs 64.5M in 2019)
Americas Tourism Ranking by Country
- Turks & Caicos: +127% (1.1M vs 500,000 in 2019)
- Dominican Republic: +40% (9M vs 6.4M in 2019)
- El Salvador: +35% (2.4M vs 1.8M in 2019)
- Colombia: +17% (5.8M vs 5M in 2019)
- Guatemala: +15% (2.9M vs 2.5M in 2019)
- Honduras: +12% (1.3M vs 1.2M in 2019)
- Jamaica: +10% (3.5M vs 3.2M in 2019)
- Aruba: +10% (1.3M vs 1.2M in 2019)
- Barbados: +8% (800,00 vs 700,000 in 2019)
- Mexico: 0% (45M vs 45M in 2019)
Asia Pacific Tourism Ranking by Country
- Maldives: +20% (1.9M vs 1.7M in 2019)
- Japan: +16% (36.9M vs 32M in 2019)
- Fiji: +10% (1M vs 900,000 in 2019)
- Sri Lanka: +7% (2M vs 1.9M in 2019)
- French Polynesia: +5% (300,000 vs 300,000 in 2019)
- New Caledonia: 0% (100,000 vs 100,000 in 2019)
- Thailand: -9% (35.5M vs 39M in 2019)
- Nepal: -10% (1.2M vs 1.3M in 2019)
- India: -15% (9.2M vs 10.9M in 2019)
- Malaysia: -27% (19M vs 26.1M in 2019)
Africa and Middle East Tourism Ranking by Country
- Qatar: +80% (4.6M vs 2.6M in 2019)
- Morocco: +35% (17.4M vs 12.9M in 2019)
- Ethiopia: +25% (1.1M vs 900,000 in 2019)
- Tanzania: +20% (1.8M vs 1.5M in 2019)
- Saudi Arabia: +18% (18.3M vs 15.5M in 2019)
- Oman: +14% (4M vs 3.5M in 2019)
- UAE: +10% (22M vs 20M in 2019)
- Tunisia: +6% (10M vs 9.4M in 2019)
- Mauritius: +2% (1.4M vs 1.4M in 2019)
- Egypt: -10% (11.7M vs 13M in 2019)
What are the prospects for tourism in 2025?
Global tourism is expected to establish new records in 2025, with arrivals projected to reach 1.55 billion, surpassing pre-pandemic levels by 5-7%.
- Projected total arrivals: 1.55 billion
- Projected receipts: $1.78 trillion
- Projected GDP contribution: $11.5 trillion (10.2% of global GDP)
- Projected employment: 371 million jobs
- Expected growth vs 2024: +5.4%
- Recovery status: New record; 105-107% of 2019 levels
Key 2025 Trends (YTD):
- Asia-Pacific is completing recovery (reached 92% of 2019 by April)
- China outbound tourism accelerating (on track for 155M+ trips)
- Strong summer season in Europe (July-August at record levels)
- Africa is maintaining double-digit growth momentum
- Middle East stabilizing after early-year softness
- Read more about Global Tourism – Forecast.
Most Visited Places in the World (2026 Forecast) – Global Tourism Outlook
Global tourism is projected to reach 1.58 billion international arrivals in 2026, representing a 5-7% increase above 2019 pre-pandemic levels and establishing a new all-time record. This outlook highlights trends for the most visited countries in the world and how major regions are expected to perform.
What is the Number One Tourist Destination in the World (2026 Forecast)?
- Based on current trends, France is expected to remain the #1 most visited country in the world in 2026, followed by Spain and the United States. Rankings will be finalized when full-year data is released, but growth continues to concentrate in countries with strong air capacity, visa facilitation, and large urban gateways.
Top Destinations in 2026: Most Popular Tourist Destinations in the World
Established leaders are expected to remain near the top in 2026. The biggest tourist destinations in the world will continue to be concentrated in Europe, followed by strong performers in the Asia Pacific and the Americas.
2026 Key Projections:
- International arrivals: 1.58 billion tourists (+2% vs 2025)
- Tourism receipts: $1.80 trillion USD (new record high)
- Tourism GDP: $12.3 trillion (10.5% of global GDP)
- Global employment: 382 million jobs supported worldwide
- Average spending per tourist: $1,180 per visitor
Regional Growth Forecast 2026:
- Europe: 770 million arrivals (+2% YoY) – mature growth trajectory
- Asia-Pacific: 375 million arrivals (+7% YoY) – fastest recovery, finally surpassing 2019
- Middle East: 105 million arrivals (+7% YoY) – 145% of 2019 levels
- Americas: 235 million arrivals (+8% YoY) – World Cup 2026 boost
- Africa: 80 million arrivals (+5% YoY) – 115% of 2019 levels
Top Growth Drivers for 2026:
- Full recovery of China’s outbound tourism (160 million trips projected)
- FIFA World Cup 2026 in North America (5+ million additional visitors)
- Winter Olympics 2026 in Italy (Milan-Cortina)
- Global air passengers exceeded the 10 billion milestone
- Visa liberalization and e-visa expansion in 50+ countries
- Digital nomad and remote work travel surge (40+ million nomads)
- India’s outbound boom (40 million trips, +10% growth)
Fastest Growing Destinations 2026:
- Saudi Arabia: +15% growth (Vision 2030 investments, mega-projects)
- Japan: +15% growth (Asia tourism recovery, weak yen advantage)
- Vietnam: +20% growth (China-driven regional travel boom)
- India: +19.6% growth (domestic and inbound expansion)
- Indonesia: +10% growth (Bali-led tourism recovery)
Major Events Shaping 2026:
- FIFA World Cup 2026 (USA, Canada, Mexico) – June to July
- Winter Olympics 2026 (Milan-Cortina, Italy) – February
- USA Semiquincentennial (250th anniversary celebrations)
Long-Term Forecast to 2030
Looking ahead to 2030, the most popular places in the world are expected to welcome approximately 1.8 billion international tourists annually.
UNWTO and WTTC Projections:
- 2030 arrivals: Approximately 1.8 billion international tourists
- 2030 tourism GDP: $14-15 trillion (approximately 11% of global GDP)
- 2030 employment: 400-430 million jobs globally
- Average annual growth 2025-2030: 3-4%
Key Growth Drivers:
- Expansion of the Asia-Pacific middle class
- China’s outbound tourism is reaching 175+ million by 2030
- India emerging as top-10 outbound market (30+ million)
- Air connectivity expansion (8.5 billion total passengers by 2030)
- Digital transformation and e-visa adoption
- Sustainable tourism investments
America & USA Travel Statistics Resources
- Arizona Statistics (incl. Grand Canyon National Park)
- California Statistics (incl. Los Angeles, San Diego, San Francisco)
- Canada Statistics (incl. Montreal, Toronto, Vancouver)
- Colorado Statistics (incl. Denver)
- Florida Statistics (incl. Destin, Key West, Miami, Orlando)
- Hawaii Statistics (incl. Kauai, Maui, Oahu)
- Illinois Statistics (incl. Chicago)
- Louisiana Statistics (incl. New Orleans)
- Massachusetts Statistics (incl. Boston)
- Mexico Statistics (incl. Cancun)
- Nevada Statistics (incl. Las Vegas)
- New York Statistics (incl. New York City)
- Panama Statistics
- Peru Statistics (incl. Machu Picchu)
- South Dakota Statistics (incl. Mount Rushmore)
- Tennessee Statistics (incl. Memphis, Nashville)
- Texas Statistics (incl. Dallas, Houston, San Antonio)
- Utah Statistics
- Washington Statistics (incl. Seattle)
Asia Pacific & Africa Travel Statistics Resources
- Australia Statistics (incl. Adelaide, Brisbane, Byron Bay, Canberra, Gold Coast, Sydney)
- China Statistics
- Dubai Statistics
- Egypt Statistics
- Hong Kong Statistics
- India Statistics
- Indonesia Statistics (incl. Bali)
- Israel Statistics
- Japan Statistics (incl. Hokkaido, Okinawa, Osaka, Tokyo)
- Malaysia Statistics
- Morocco Statistics
- New Zealand Statistics (incl. Auckland, Queenstown, Wellington)
- Saudi Arabia Statistics
- Singapore Statistics
- South Korea Statistics
- Sri Lanka Statistics
- Thailand Statistics (incl. Bangkok)
- Turkey Statistics
Europe Travel Statistics Resources
- Austria Statistics
- Belgium Statistics
- Croatia Statistics
- Denmark Statistics
- France Statistics (incl. Paris)
- Georgia Statistics
- Germany Statistics (incl. Berlin)
- Greece Statistics (incl. Parthenon)
- Iceland Statistics
- Italy Statistics (incl. Florence, Milan, Rome, Venice)
- Netherlands Statistics (incl. Amsterdam)
- Norway Statistics
- Portugal Statistics (incl. Lisbon)
- Spain Statistics (incl. Barcelona, Madrid, Mallorca)
- Sweden Statistics
- Switzerland Statistics
- UK Statistics (incl. Edinburgh, Glasgow, London, Oxford, Scotland)
Other Tourism Statistics
Reference
UNWTO: World Tourism Barometer January 2025
WTTC: Economic Impact Research 2024-2025
Euromonitor: Top 100 City Destinations 2024
IATA: Air Transport Statistics and Forecasts
National Tourism Boards and Statistical Offices: France, Spain, USA, Japan, Saudi Arabia, and other major destinations