Page last updated: 3 March 2026
Phoenix Sky Harbor International Airport (PHX) is Arizona’s main airline hub and a top‑10 U.S. airport by passenger volume.
How many passengers travel through Phoenix Sky Harbor International Airport each year?
Phoenix Sky Harbor International Airport handles nearly 50 million passengers annually.
- PHX served 51.62 million passengers in 2025, a 1.4 % decrease from 52.33 million in 2024.
- Passenger traffic reached 48.65 million in 2023, up 9.6 % from 2022 and surpassing the pre-pandemic record of 46.29 million set in 2019.
- Traffic fell to 21.93 million in 2020 during the pandemic.

International vs Domestic Passengers
International traffic is climbing, yet PHX remains a predominantly domestic gateway.
- Domestic passengers: 48.81 million in 2025 (94.6% of total volume).
- International passengers: 2.81 million in 2025 (5.4% of total) and a 3.8% decrease from 2024.

Enplaned vs Deplaned Passengers
Phoenix Sky Harbor International Airport maintains nearly perfect balance between arriving and departing passengers, typical of major connecting hubs.
- The Airport recorded 25.89 million enplaned passengers in 2025, a 1.2% decrease from 26.21 million in 2024.
- Deplaned passengers totaled 25.73 million in 2025, a 1.5% YoY decrease (26.12 million in 2024)
Passenger Flow: Enplaned vs Deplaned (2019-2025)
| Year | Enplaned (in Millions) | Deplaned (in Millions) |
| 2019 | 23.22 | 22.07 |
| 2020 | 10.96 | 10.97 |
| 2021 | 19.49 | 19.36 |
| 2022 | 22.30 | 22.10 |
| 2023 | 24.50 | 24.16 |
| 2024 | 26.21 | 26.12 |
| 2025 | 25.89 | 25.73 |
Busiest Terminal at Phoenix Sky Harbor International Airport
Terminal 4 is the busiest terminal at Phoenix Sky Harbor International Airport.
- Terminal 4 handled 36.73 million domestic passengers in 2025.
- Terminal 3 served 12.08 million domestic passengers the same year.

Aircraft Operations at Phoenix Sky Harbor International Airport
PHX manages more than 400,000 takeoffs and landings annually.
- 487,143 operations in 2025, compared with 485,745 in 2024 and 454,665 in 2023.
- Operations dipped to 310,324 in 2020 before recovering through 2021 (408,285) and 2022 (418,856).

Aircraft Operations by Type
- The majority of aircraft operations at the airport were handled by Air Carrier and Air Taxi flights in 2025, totaling 465,903 operations.
- This far exceeded the number of operations by General Aviation, which recorded 20,046 operations, and Military aircraft, which accounted for 1,194 operations.
Aircraft Operations at PHX International Airport by Type (2019-2025)
| Year | Air Carrier/ Air Taxi | General Aviation | Military |
| 2019 | 416,396 | 20,401 | 2,094 |
| 2020 | 290,971 | 17,371 | 1,982 |
| 2021 | 382,601 | 23,583 | 2,101 |
| 2022 | 393,010 | 23,823 | 2,023 |
| 2023 | 429,570 | 22,814 | 2,281 |
| 2024 | 460,943 | 22,531 | 2,271 |
| 2025 | 465,903 | 20,046 | 1,194 |
Note: Air taxi operations refer to on-demand commercial flights using small aircraft and are classified under general aviation, which includes all non-scheduled civil aviation activities outside commercial airline services.
Which airlines operate the most flights out of Phoenix Sky Harbor International Airport?
The airline landscape at Phoenix Sky Harbor is dominated by two major carriers, American Airlines and Southwest Airlines, which carry over 70% of total passengers.
- American Airlines carried the most passengers in 2025, serving 20.89 million travelers and capturing 40.5% of the market share.
- Southwest Airlines served 17.20 million passengers, accounting for 33.3% of the total.
- Delta Airlines served 3.66 million passengers (7.1%), United Airlines carried 3.22 million (6.2%), and Frontier Airlines handled 2.30 million passengers (4.5%).
Top 10 Airlines at PHX Airport by Passenger Volume (2025)
| Airline | Total Passenger (in Millions) | Market Share |
| American Airlines | 20.89 | 40.5% |
| Southwest Airlines | 17.20 | 33.3% |
| Delta Airlines | 3.66 | 7.1% |
| United Airlines | 3.22 | 6.2% |
| Frontier Airlines | 2.30 | 4.5% |
| Alaska Airlines | 1.73 | 3.4% |
| WestJet | 0.47 | 0.9% |
| JetBlue Airways | 0.32 | 0.6% |
| Air Canada | 0.29 | 0.6% |
| Sun Country | 0.28 | 0.5% |
Monthly Trends in Passenger Traffic at PHX
Traffic peaks during Arizona’s winter and spring.
- March 2025 was the busiest month (5.06 million passengers).
- April (4.58 million), May (4.58 million) and December (4.69 million) also saw strong volumes.
- August and September were the slowest months, at 3.79 million and 3.71 million passengers respectively.

Top Destinations from Phoenix Sky Harbor International Airport
Domestic Destinations
- In 2024, the top domestic destination from Phoenix Sky Harbor International Airport was Denver (1.26 million passengers).
- Following Denver, the most frequented routes were Seattle (943,000 travelers) and Chicago (900,000).
- Las Vegas (874,000 passengers) and Dallas/Fort Worth (820,000) completed the list of the five most popular destinations.

International Destinations
- San José del Cabo, Mexico (SJD), was the leading international destination from PHX, with 457,831 passengers.
- London, United Kingdom (LHR), and Calgary, Canada (YYC), ranked next with 334,863 and 312,085 travelers, respectively.
- Puerto Vallarta (310,506) and Cancún (219,996), both in Mexico, complete the top five international destinations.

Phoenix Travel Resources
How much cargo does Phoenix Sky Harbor International Airport handle annually?
Phoenix Sky Harbor International Airport handles around 400,000 tons of cargo annually, however, 2023 and 2024 saw a notable drop in cargo volume.
- PHX moved 362,702 tons of cargo and mail in 2025, a 6.9% increase from 339,149 tons in 2024.
- Cargo peaked at 446,295 tons in 2021 then fell to 420,247 tons in 2022 and 358,458 tons in 2023.
- Pre-pandemic year 2019 recorded 393,132 tons of cargo, while the airport handled 420,418 tons of cargo in 2020.

How many delays or cancellations occurred at Phoenix Sky Harbor International Airport in the last year?
- On-time departures: 79 %, ranking 6th nationally.
- On-time arrivals: 80 %, ranking 3rd.
- Cancellations: 0.61 %, the best rate among major U.S. airports.
- Average departure delay: 62.65 minutes.
- Average arrival delay: 73.39 minutes.
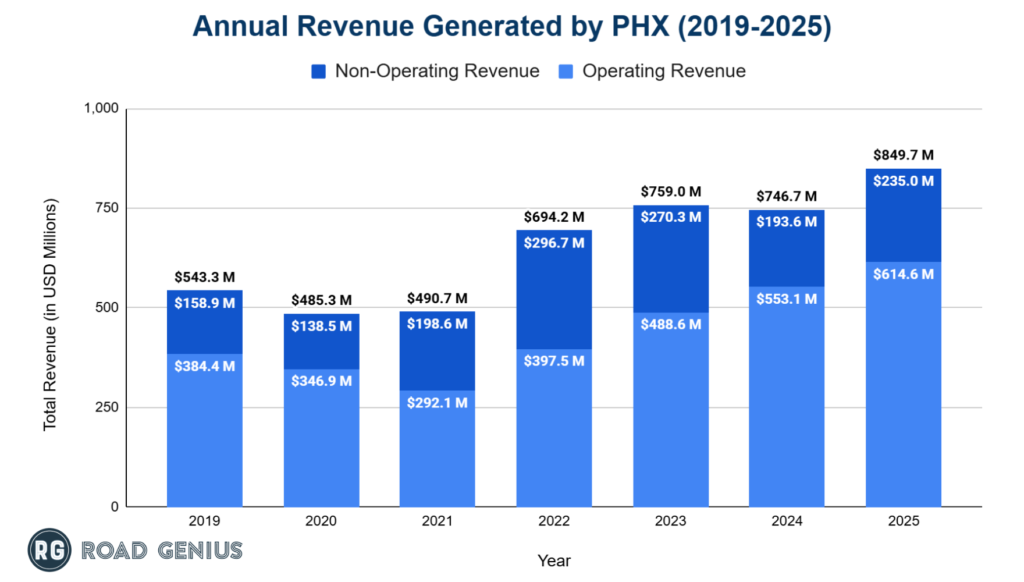
How much revenue has Phoenix Sky Harbor International Airport generated each year?
Phoenix Sky Harbor International Airport’s total revenue has grown to over $700 million annually in recent years.
- The airport grossed $543.3 million in 2019, which dropped by 10.7% to $485.3 million in 2020 due to the pandemic.
- A strong rebound came in 2022 and revenue increased by 41.5% YoY to $694.2 million.
- The upward trend continued in 2023 with a 9.4% increase to $759.0 million.
- In 2024, revenue declined by 1.6% to $746.7 million, before climbing again to $849.6 million in 2025.
Other Relevant Statistics Related to PHX
- The City of Phoenix bought Sky Harbor in July 1935 for $100,000, paying $35,300 in cash and taking a $64,700 mortgage.
- Airport footprint: 3,400 acres.
- Parking capacity: more than 21,000 spaces.
- Terminal 1 was demolished in 1990; Terminal 2 closed in February 2020.
- Terminal 3 size: 880,000 sq ft.
- Terminal 4 size: 3.9 million sq ft.
- Runways:
- North: 11,489 ft long, 150 ft wide
- Center: 10,300 ft long, 150 ft wide
- South: 7,800 ft long, 150 ft wide
Other US Airport Statistics
- Charlotte Douglas International Airport Statistics
- Dallas Fort Worth International Airport Statistics
- Denver International Airport
- Detroit Metropolitan Airport Statistics
- Fort Lauderdale-Hollywood International Airport (FLL) Statistics
- George Bush Intercontinental Airport (IAH) Statistics
- Harry Reid International Airport (LAS)
- Hartsfield–Jackson Atlanta International Airport
- John F. Kennedy International Airport Statistics
- LaGuardia Airport (LGA) Statistics
- Logan International Airport (BOS) Statistics
- Los Angeles International Airport
- Miami International Airport
- Minneapolis-Saint Paul International Airport (MSP) Statistics
- Newark Liberty International Airport (EWR) Statistics
- Orlando International Airport (MCO)
- O’Hare International Airport
- San Francisco International Airport Statistics
- Seattle-Tacoma International Airport Statistics
USA Travel Statistics Resources
- Arizona Statistics (incl. Grand Canyon National Park)
- California Statistics (incl. Los Angeles, San Diego, San Francisco, Universal Studios Hollywood)
- Florida Statistics (incl. Destin, Key West, Miami, Orlando, Universal Orlando, Walt Disney World)
- Hawaii Statistics (incl. Kauai, Maui, Oahu)
- Illinois Statistics (incl. Chicago)
- Louisiana Statistics (incl. New Orleans)
- Massachusetts Statistics (incl. Boston)
- Nevada Statistics (incl. Las Vegas)
- New York Statistics (incl. New York City, Statue of Liberty)
- South Dakota Statistics (incl. Mount Rushmore)
- Tennessee Statistics (incl. Memphis, Nashville)
- Texas Statistics (incl. Dallas, Houston, San Antonio)
- Utah Statistics
- Washington Statistics (incl. Seattle)
- Yellowstone National Park Statistics